Figure 4.
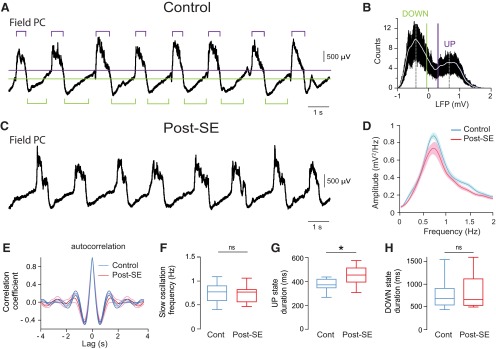
Comparing neocortical local field potential slow oscillations between control and post-SE rats. A, Example LFP recorded in the parietal cortex in a control rat, with the threshold levels used to detect UP or DOWN states indicated by horizontal bars (green, DOWN state; purple, UP state). B, Histogram of the distribution of LFP values for the trace shown in A. The level for DOWN state detection (green vertical line) was set at the lower two-thirds of the distance between the peaks of the bimodal distribution of LFP values. The level for UP state detection (purple vertical line) was set at the higher two-thirds of the distance between the peaks of the bimodal distribution of LFP values. C, Example LFP recorded in the parietal cortex from a post-SE rat. D, Mean power spectrum of the LFPs recorded in the parietal cortex. Control (n = 10) and post-SE (n = 10) in D–H. E, Average autocorrelogram of LFPs in control (blue line) and post-SE (red line) conditions with a nonsignificant difference at the negative peaks. F, Box plots of the frequency of the neocortical SWO in control and post-SE rats. G, Box plots of neocortical UP state duration in control and post-SE rats. H, Box plots of neocortical DOWN state duration in control and post-SE rats. Light blue- and pink-shaded areas in D and thinner lines in E indicate SEM. ns, p > 0.05; *p < 0.05. For description of box plots, see the legend of Figure 3.

