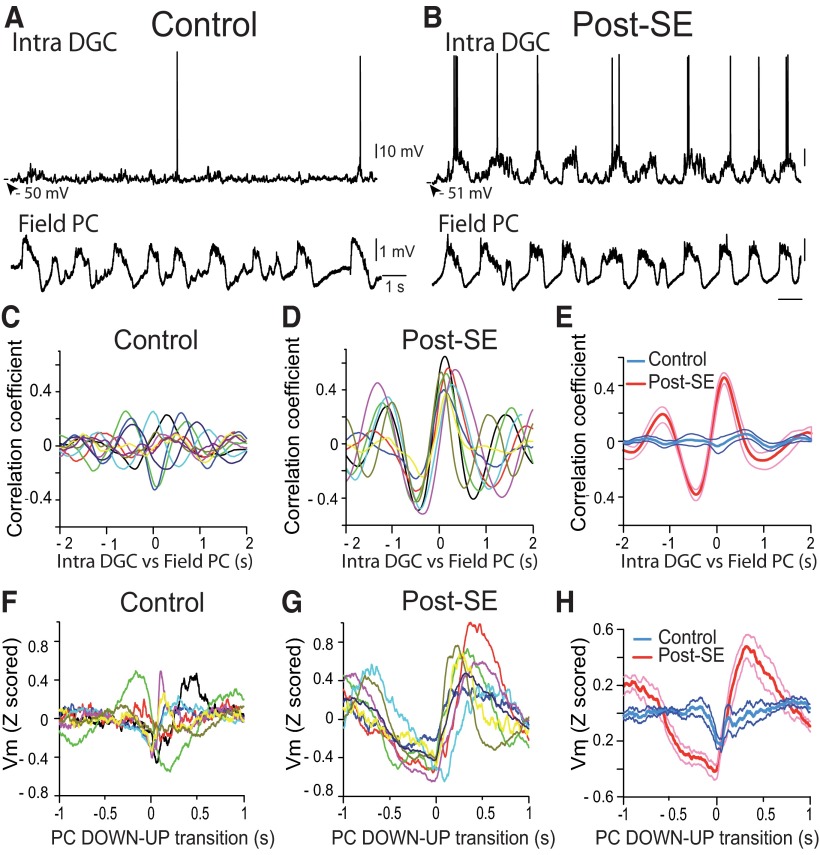
Figure 5.
Strong temporal correlation between the membrane potential of dentate granule cells and the parietal cortex local field potential in post-SE rats, but not in control rats. A, Vm of a DGC from a control rat (top) and simultaneously recorded LFP in the parietal cortex (bottom). B, Same as in A for a DGC from a post-SE rat. Scale bars are as in A. C, Vm vs LFP cross-correlograms for all individual DCGs from control rats (n = 10). D, Same as in C for DGCs from post-SE rats (n = 8). E, Average Vm vs LFP cross-correlogram of all DGCs recorded in control rats (blue line, n = 10) and post-SE rats (red line, n = 8). F, DOWN–UP transition-triggered Vm for all individual DGCs from control rats (n = 10). G, Same as in F for DGCs from post-SE rats (n = 8). H, Average DOWN–UP transition-triggered Vm for DGCs recorded in control rats (blue line, n = 10) and post-SE rats (red line, n = 8). Thinner lines in E and H represent ±SEM.

