Figure 8.
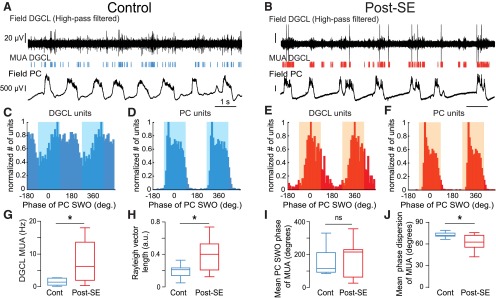
Increased rate and slow temporal modulation of multiunit activity in the dentate granule cell layer in post-SE vs control rats. A, B, High-pass-filtered (1000 Hz) local field potential recording in the dentate granule cell layer (DGCL; top) showing MUA (vertical bars) and simultaneously recorded local field potential in the parietal cortex (PC; bottom) in a control rat (A) and a post-SE rat (B). The scale bar values in B are the same as in A. C, D, Phase histogram of MUA from the recording shown in A (C) and simultaneously recorded in the parietal cortex (D). The blue-shaded area depicts the UP phase of SWO in the parietal cortex. E, F, Same layout as C and D for the recordings illustrated in B. The orange-shaded area depicts the UP phase of the SWO in the parietal cortex. G, Box plots of the frequency of MUA recorded in the DGCL. n = 7 control and n = 17 post-SE rats in this and all subsequent panels. H, Box plots of the length of Rayleigh vector of MUA recorded in the DGCL in control and post-SE rats. I, Box plots of the preferred phase of MUA recorded in the DGCL for all recordings in control and post-SE rats in reference to SWO recorded in the PC. J, Box plots of the dispersion of DGCL MUA around the mean phase of SWO recorded in the PC in control and post-SE rats. Ns, p > 0.05; *p < 0.05. For a description of box plots, see the legend of Figure 3.

