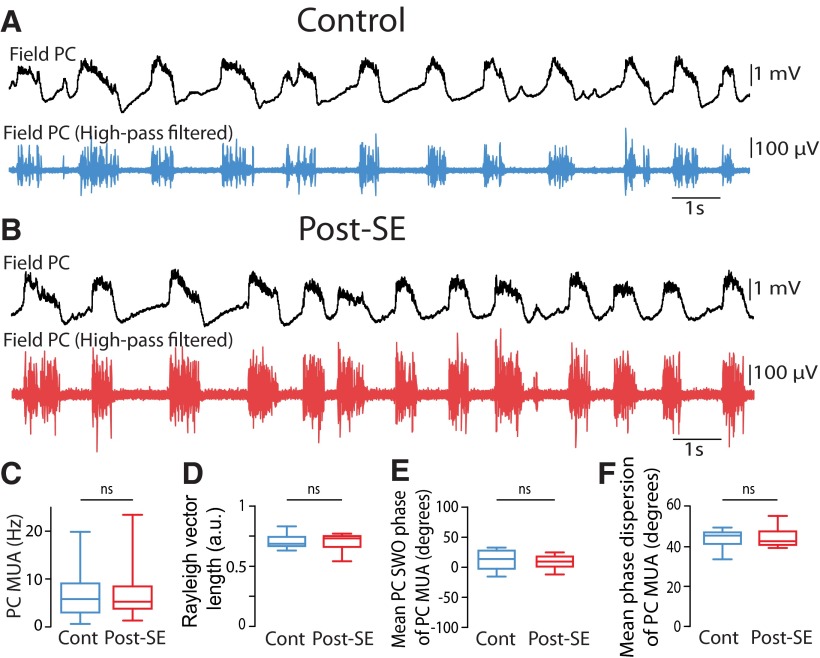
Figure 9.
Modulation of neocortical multiunit activity by the slow neocortical oscillation in control and post-SE rats. A, B, Raw (top, black) and high-pass filtered (1000 Hz, bottom) local field potential showing MUA recorded in the parietal cortex from a control rat (A) and a post-SE rat (B). C, Box plots of the frequency of MUA recorded in the parietal cortex. n = 14 control rats and n = 17 post-SE rats in this and all subsequent panels. D, Box plots of the length of the Rayleigh vector in control and post-SE conditions. E, Box plots of preferred SWO phase of PC MUA in control and post-SE conditions. F, Box plots of the dispersion of PC MUA around the mean SWO phase for control and post-SE conditions. ns, p > 0.05. For a description of box plots, see the legend of Figure 3.

