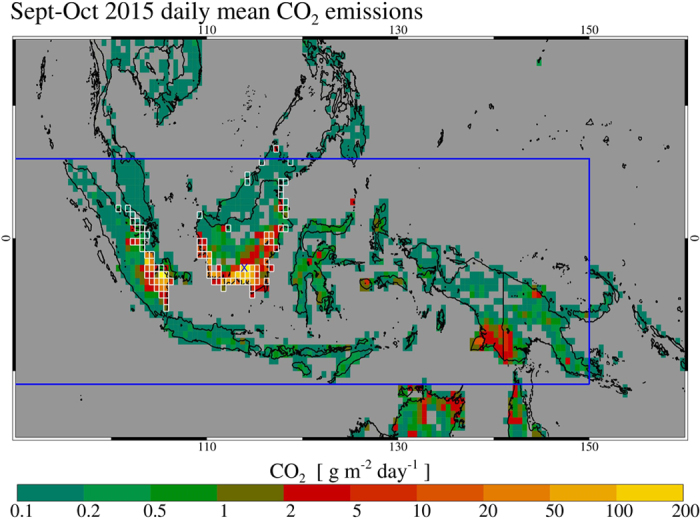
Figure 1. Daily mean CO2 emissions from peat and vegetation fires burning across maritime southeast Asia in Sept-Oct 2015, presented in 0.5° × 0.5° grid cells.

Cells containing peat soils according to landcover data used in GFAS23 are outlined in white (see Supplementary Information B). Locations of our in situ trace gas measurements lie close to the Central Kalimantan Capital of Palankaraya, Kalimantan (113.92°E, 2.21°S), indicated with the blue cross (See also Fig. 3). The thick blue line indicates the border of the study domain (east part only shown, full range 70°E–150°E; 11°S–6°N). Map was generated using IDL v8.4 software, http://www.exelisvis.com.
