Figure 1.
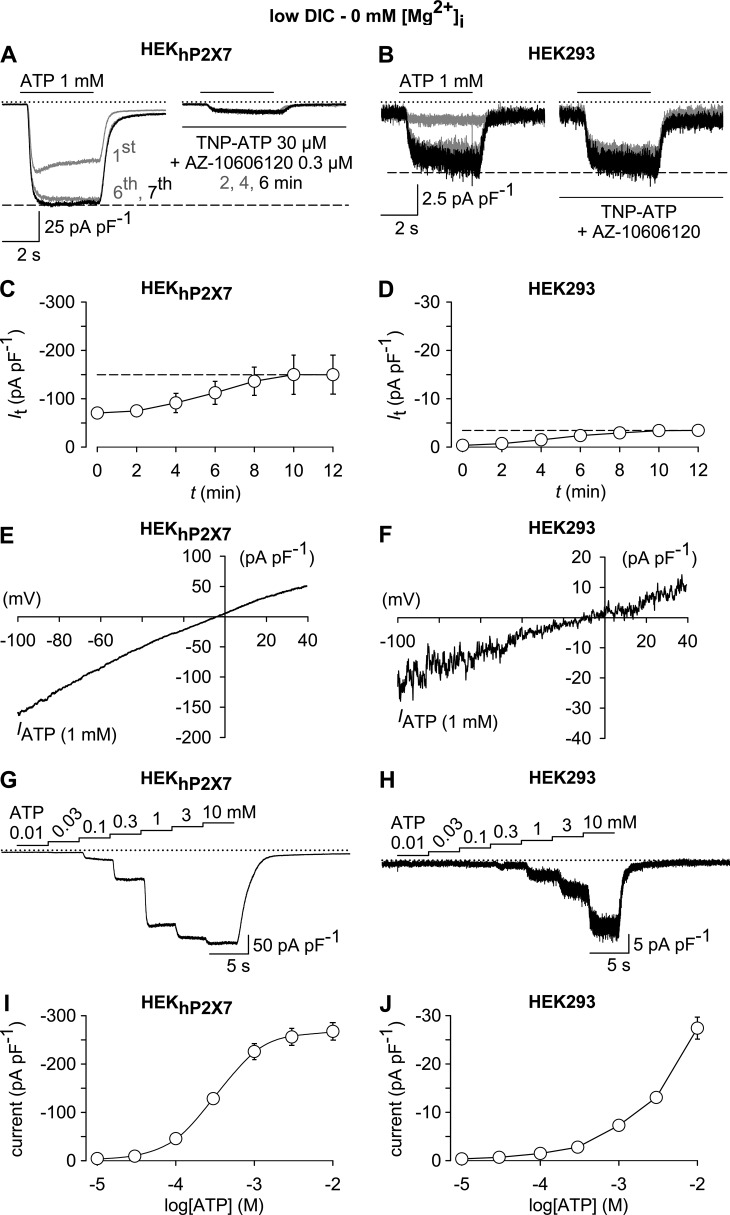
Similarities and dissimilarities between ATP-induced whole-cell currents in HEKhP2X7 and HEK293 cells. (A and B) Superimposed whole-cell currents obtained in HEKhP2X7 (A) or HEK293 cells (B) in response to 1 mM ATP during preconditioning (left) and after 2, 4, and 6 min in the presence of a P2X receptor–blocking mixture of TPNP-ATP (30 µM) and AZ-10606120 (0.3 µM; right). Note the only partial inhibition by the antagonist cocktail in HEKhP2X7 cells, as well as the insensitivity of ATP-responses in HEK293 cells. (C and D) Statistical evaluation of the preconditioning phase in experiments similar to those in A and B, showing a comparable amplitude run-up in HEKhP2X7 (C) and HEK293 cells (D; n = 7 each). (E and F) I/V relationship of net ATP (1 mM)-induced currents (IATP) in HEKhP2X7 (E) and HEK293 cells (F) showing an almost linear behavior over the voltage range tested (−100 to 40 mV), as well as a reversal potential close to 0 mV for both cell lines. (G–J) Representative whole-cell currents (G and H) and their statistical evaluation (I and J), showing ATP concentration-response curves in HEKhP2X7 (G and I) and HEK293 cells (H and J; n = 11 each). The EC50 value and the Hill slope derived from the HEKhP2X7 cell responses were 339 ± 27 µM and 1.7 ± 0.2, respectively. All recordings were performed in a low-DIC bath, using a Mg2+-free pipette solution, and cells were at first repetitively stimulated for 4-s and at 120-s intervals (preconditioning) with 1 mM (A–F) or 10 mM ATP (G–J; not depicted) until current run-up was completed. IATP in E and F was obtained by digitally subtracting responses to 1-s voltage ramps imposed in the absence of ATP from those recorded in the presence of the activator. ATP concentration-response curves (G–J) were constructed from responses to subsequent 4-s challenges with stepwise increasing concentrations of the agonist. In electrophysiological figures, dotted lines indicate the zero current level. Error bars indicate SEM.

