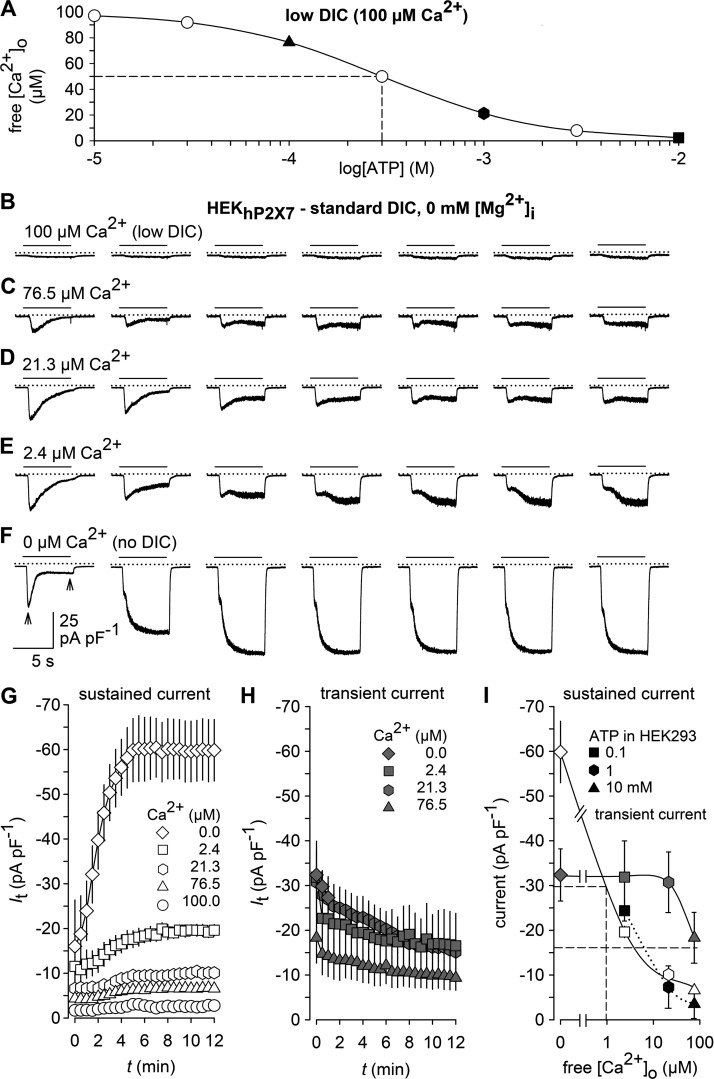
Figure 2.
Effects of [Ca2+]o on membrane conductance. (A) Calculated free Ca2+ concentration in a bath containing 100 µM Ca2+ (low DIC) and variable concentrations of ATP. Filled symbols indicate solutions with Ca2+ concentrations used for stimulation in C–E. (B and F) Typical patterns of membrane currents in response to the indicated acute drops in [Ca2+]o, caused by bath solutions, in which the indicated free [Ca2+]o was adjusted by buffering with EGTA and EDTA instead of ATP. Responses in C–E correspond to the theoretical Ca2+-lowering effect of 0.1, 1, and 10 mM ATP, respectively. Note that only every fourth response is shown for clarity. (G and H) Statistical evaluation of experiments similar to those in B–F (n = 10 each). The amplitudes of the sustained (G) and the transient current components (H) in response to lowered [Ca2+]o were measured, as indicated by the arrows in the left panel of F, at the end of the stimulation and at the peak response, respectively. (I) Concentration-dependent effects of bath Ca2+ on membrane conductance. Apparent IC50 values (broken drop lines) were ∼1 µM Ca2+ for the sustained current and >76.5 µM Ca2+ for the transient current. Curves for the sustained (open symbols) and transient current component (gray symbols) were constructed from the maximum responses in G and H. Current amplitudes evoked by 0.1, 1, and 10 mM ATP in P2X receptor–devoid HEK293 cells (black symbols) are replotted from Fig. 1 J for comparison. Recordings were performed in a standard DIC bath, using a Mg2+-free pipette solution, and cells were repetitively stimulated for 6 s at 30-s intervals with bath solutions of the indicated Ca2+ content. In electrophysiological figures, dotted lines indicate the zero current level. Error bars indicate SEM.

