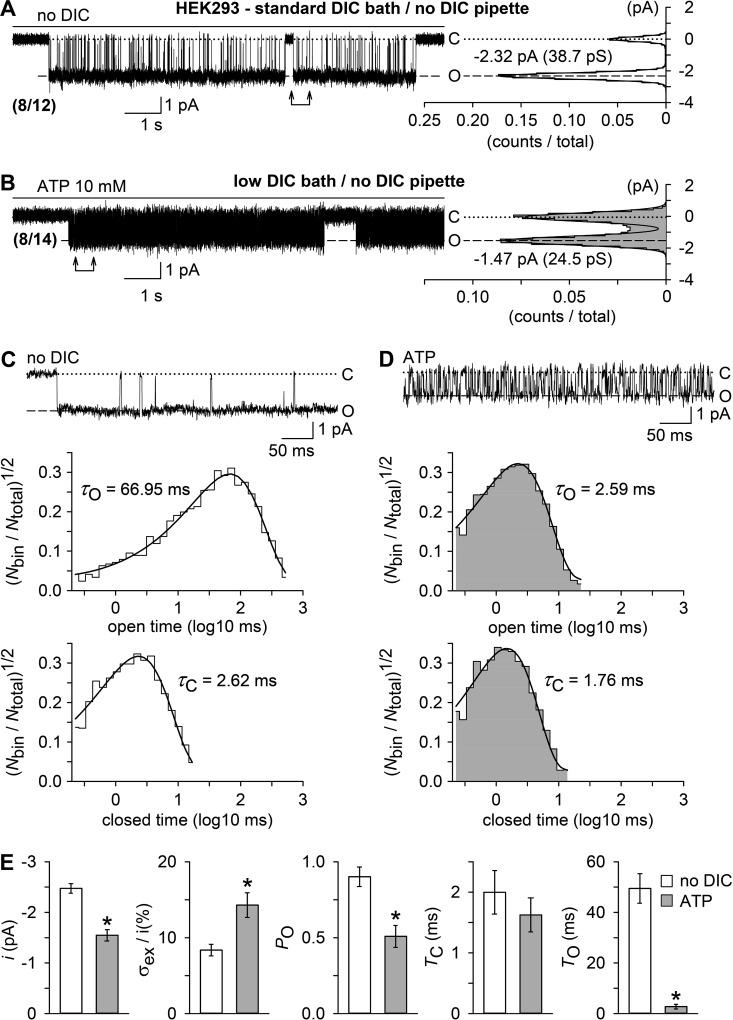
Figure 5.
Unitary currents evoked by a DIC-free bath solution (no DIC) or by ATP in outside-out patches. Outside-out membrane patches were excised from parental HEK293 cells in standard DIC bath and no-DIC pipette solutions. (A and B) Examples of single channel currents, shown to the left, and respective all-point histograms (0.1 pA/bin) with superimposed Gaussian distributions, shown to the right, recorded in the absence of DICs (no DIC, 0 µM [Ca2+]o; A) or ATP (10 mM, 2.4 µM [Ca2+]o; B). Numbers in parentheses give the fraction of patches that responded with single open levels to either treatment. Inward currents are shown as downward deflections, and “C” and “O” indicate the closed and open level. The vertical axis in the histograms (current level, pA) has the same scale as the current traces, and the horizontal axis, the fractional point count (counts/total), includes 453 and 4,147 dwells from the 12-s data epochs in A and B, respectively. (C and D) The top panels show, at a higher time resolution, unitary current activity from the data sections specified by arrows in A and B. Note the smaller current amplitudes and a flickering behavior of channels in the presence of ATP (D). The bottom panels illustrate, from top to bottom, open and closed time histograms (∼10 bins/decade) in the presence of no DIC (C) or ATP (D, gray shading), derived from idealization of recordings as shown in A and B but cumulated from multiple bursts of activity (C, 3,521 dwells in 12 bursts; D, 19,962 dwells in 5 bursts). Displayed is the square root–transformed ratio of the number of events per bin to the total number of events ((Nbin/Ntotal)1/2) versus the logarithm of the bin width (log10 ms). Overlaying continuous black curves in the histograms represent probability density distributions. Respective opening (τO) and closing time constants (τC) are indicated. Note that distributions were seemingly single-peaked. (E) Statistical analysis of experiments similar to those in A and B (n = 8 each), showing, from left to right, unitary current amplitudes (i), relative excess open channel noise levels (σex/i) and intraburst open probabilities (PO) of the channels activated by no DIC (open bars) or ATP (filled bars), derived from all-point histograms, as well as mean intraburst closed (TC) and open times (TO), derived from data idealization. *, P < 0.001, significantly different from the channel activity evoked by no DIC. In electrophysiological figures, dotted lines indicate the zero current level. Error bars indicate SEM.

