Figure 7.
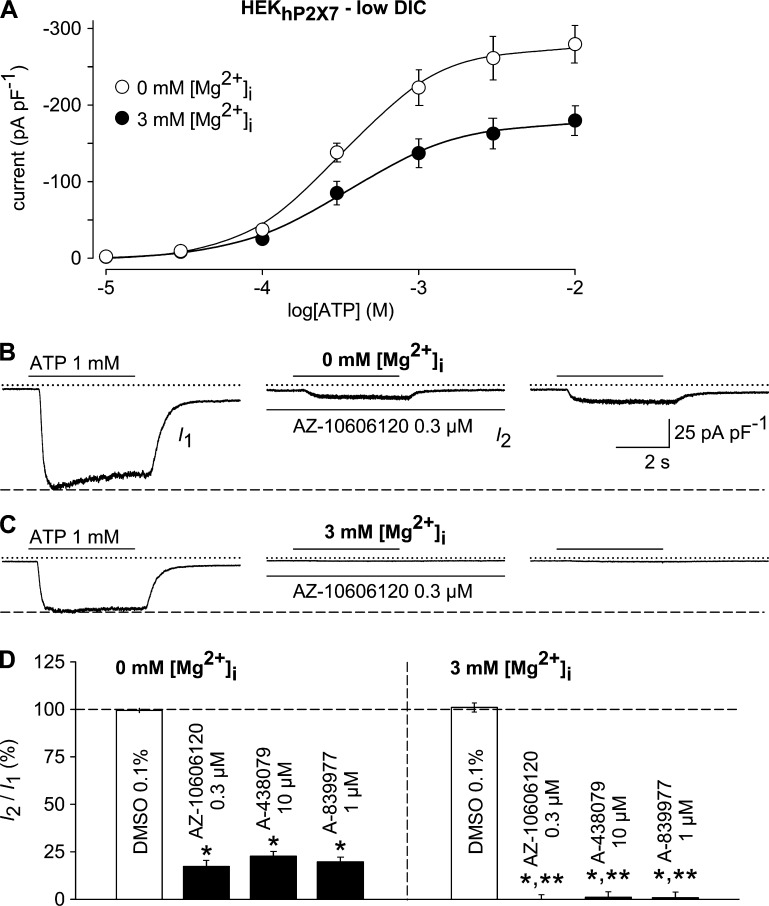
Impact of TRPM7 coactivation on hP2X7 pharmacology. (A) ATP concentration-response curves were constructed as in Fig. 1 (G–J) and obtained in the absence (open circles) and presence of 3 mM intracellular Mg2+ (filled circles; n = 11 each). Note the ∼30% smaller responses to ATP when TRPM7 was blocked by internal Mg2+. (B and C) 1 mM ATP–induced currents, obtained with a Mg2+-free (B) or a Mg2+-containing (3 mM) pipette solution (C), were recorded before (left, I1), 6 min after the addition of AZ-10606120 (0.3 µM; middle, I2), and 6 min after removal of the compound (right). (D) Statistical analysis of experiments performed as outlined in B (left, 0 mM [Mg2+]i) and C (right, 3 mM [Mg2+]i; n = 9–11 each). ATP-induced peak currents in the presence of 0.3 µM AZ-10606120, 10 µM A-438079, or 1 µM A-839977 were normalized to the respective pre-application peak currents (I1). Significant differences to the DMSO controls (*, P < 0.001) and significant differences to the respective drug effects obtained with 0 mM [Mg2+]i (**, P < 0.001) are depicted. Recordings were performed in low-DIC bath after current run-up in response to repetitive stimulation with 1 mM ATP was completed (not depicted). In electrophysiological figures, dotted lines indicate the zero current level. Error bars indicate SEM.

