Figure 3.
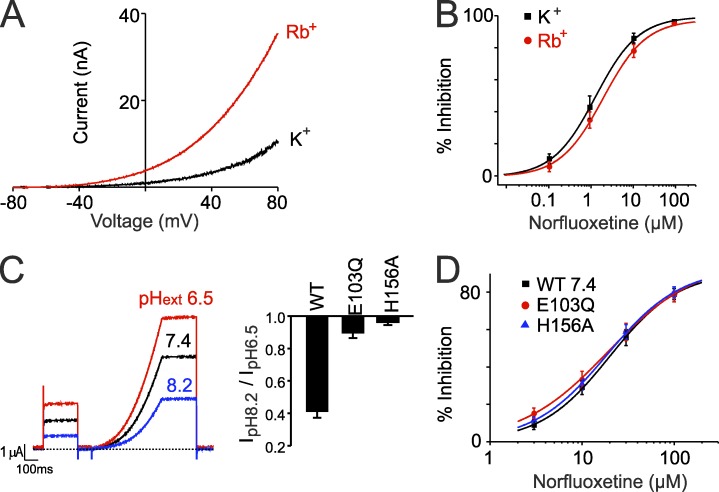
Direct activation of the filter gate without major conformational changes. (A) Example traces from inside-out patches showing activation of TREK-2 currents upon exchange of intracellular K+ for Rb+. (B) Summary dose–response curves showing NFx inhibition of TREK-2 does not change when Rb+ is used as the permeant ion to directly activate the filter gate. (C) Example showing activation of whole-cell currents upon extracellular acidification. Bar chart shows the effect of the H156A and E103Q mutations that abolish pHext activation by interfering with the filter gating mechanism (Dong et al., 2015). (D) Dose–response curves from two-electrode voltage clamp recordings of whole-cell currents showing that neither mutation reduces NFx inhibition (WT IC50 = 23.4 ± 3.9 µM, n = 10; E103Q IC50 = 18.3 ± 2.3 µM, n = 7; H156A IC50 19.1 ± 2.1 µM, n = 11). Note that when applied extracellularly, higher concentrations of NFx are required to inhibit channel activity. (B–D) Error bars shown are mean ± SEM (n ≥ 6).

