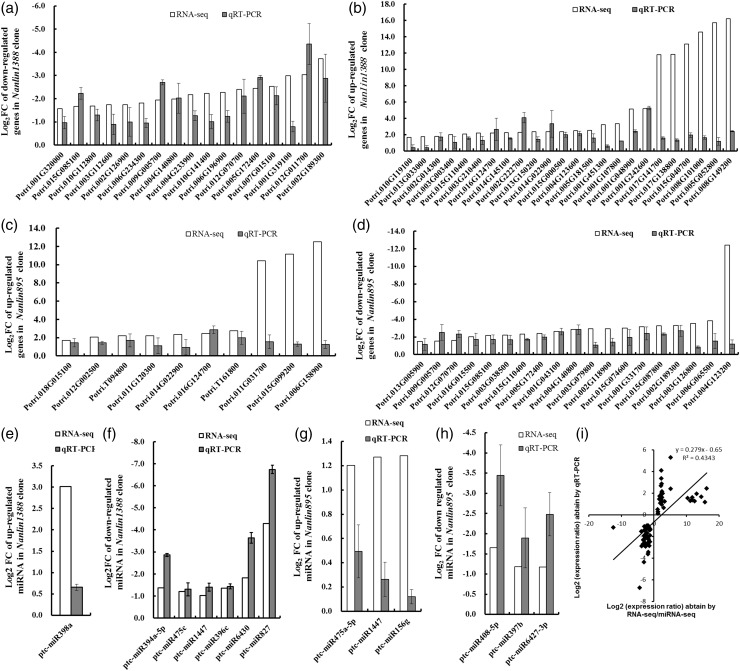
Figure 5.
Quantitative RT-PCR validation of differentially expressed mRNAs in P. euramericana. (a) Downregulated mRNAs in Nanlin 1388, (b) upregulated mRNAs in Nanlin 1388, (c) upregulated mRNAs in Nanlin 895, (d) downregulated mRNAs in Nanlin 895, (e) upregulated miRNAs in Nanlin 1388, (f) downregulated miRNAs in Nanlin 1388, (g) upregulated miRNAs in Nanlin 895 and (h) downregulated miRNAs in Nanlin 895. (i) Correlation of the gene expression ratios obtained from qRT-PCR and microarray data. The qRT-PCR log2 value of the expression ratio (y-axis) has been plotted against the value from the microarray (x-axis). Data were expressed as log2FC (fold change), FC value corresponding to N stress expression vs control expression.

