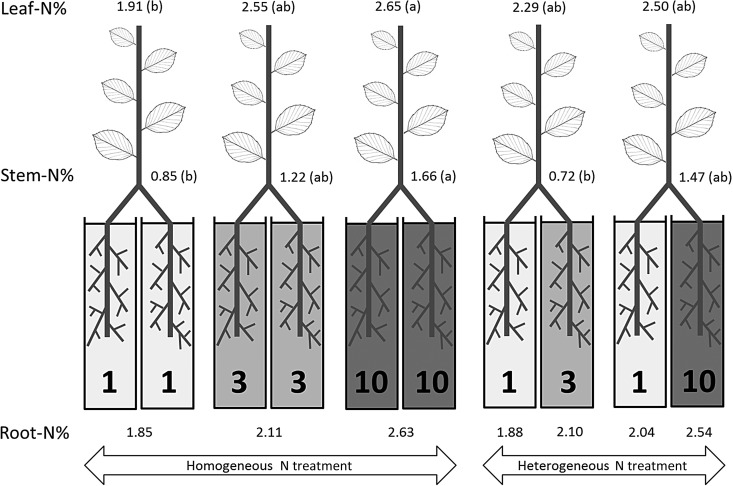
Figure 1.
Nitrogen concentration (% DW) in leaves, stems and roots as affected by N supply in the greenhouse experiment (the numbers 1, 3 and 10 refer to the three different levels of N supply). For leaf or stem N concentrations, different letters (in brackets) indicate significantly different values according to Tukey’s test (P = 0.05). Nutrient addition significantly affected root N concentration among the 1, 3 and 10 homogeneous treatments (P < 0.05) and in the heterogeneous treatments, 1 vs 10 (P < 0.05).

