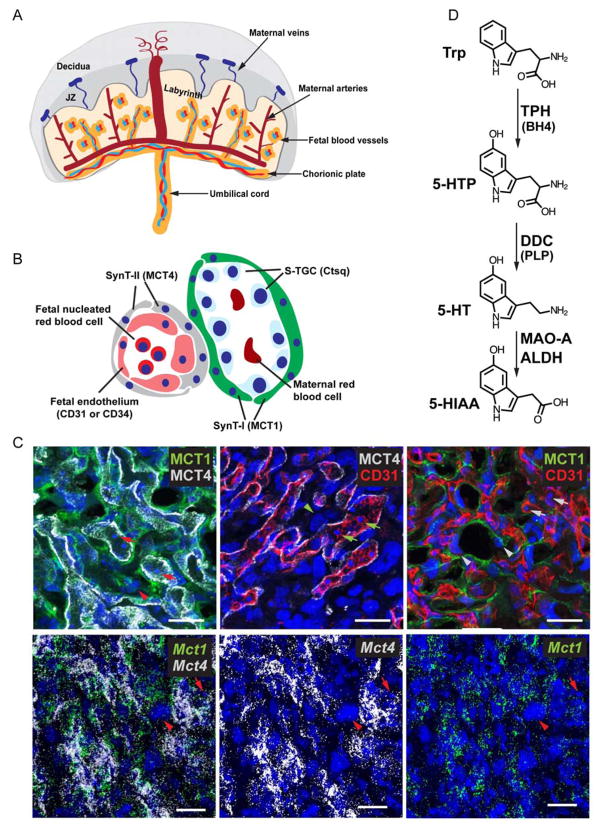
Fig 1. Different cell types and their molecular markers in the labyrinth.
(A) Diagram showing the general structure of the murine placenta. (B) Schematic drawing depicting the cell types and cell organizations in the labyrinth. Molecular markers used to label specific cell type are shown in parentheses. SynT-I, syncytiotrophoblast I; SynT-II, syncytiotrophoblast II; S-TGC, sinusoidal trophoblast giant cell. (C) Top panels: Co-IF used to detect SynT-I, SynT-II, and fetal endothelial cells using antibodies against MCT1, MCT4, and CD31, respectively. Bottom panels: Multiplex fluorescent ISH used to detect Mct1 and Mct4 mRNA. Arrowheads point to S-TGC. Arrows point to fetal nucleated red blood cell. Scale bar = 30 μm. (D) Diagram of the serotonin metabolic pathway. Serotonin (5-hydroxytryptamine, 5-HT) synthesis begins with hydroxylation of tryptophan, an essential amino acid, by tryptophan hydroxylase (TPH1 or TPH2), in a tetrahydrobiopterin (BH4)-dependent manner. This reaction is followed by a pyridoxal phosphate (PLP)-dependent decarboxylation by dopa decarboxylase (DDC, also called aromatic L- amino acid decarboxylase). 5-HT is cleared from cells after being converted to 5-HIAA by MAO-A and ALDH. Trp, tryptophan; 5-HTP, 5-hydroxytryptophan; DDC, dopa decarboxylase; PLP, pyridoxal phosphate; MAO-A, monoamine oxidase A; ALDH, aldehyde dehydrogenase; 5-HIAA, 5-hydroxyindoleacetic acid.

