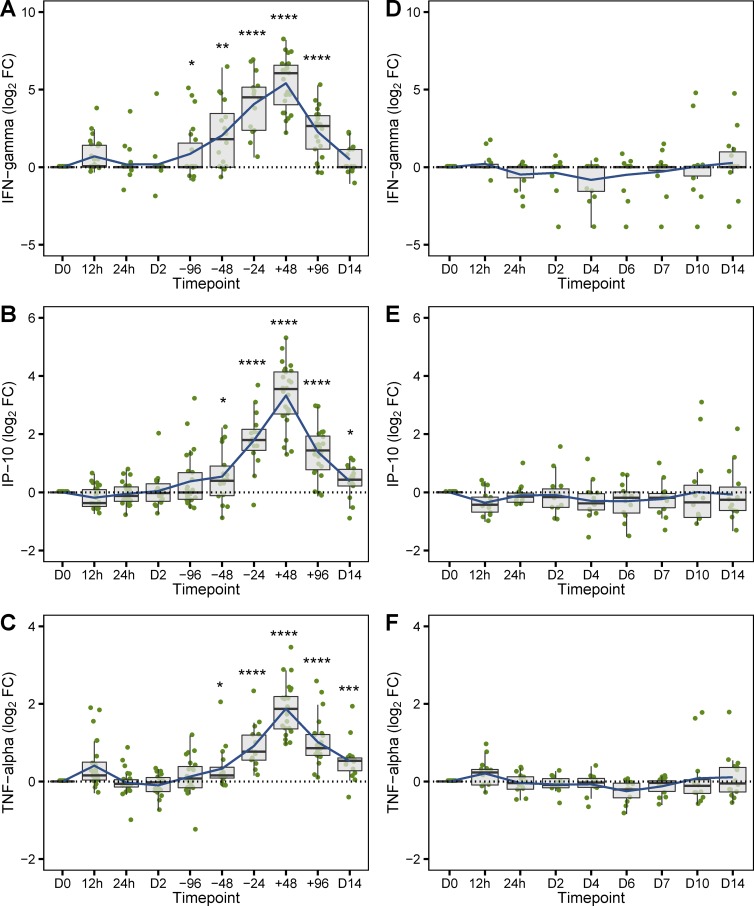
Figure 4.
Longitudinal plasma cytokine profiles of participants challenged with S. Typhi. Longitudinal cytokine response profiles [log2 FC/D0] for participants developing typhoid fever (A–C, n = 25) and those who were not diagnosed after challenge (D–F, n = 16). Data are median with 25th/75th percentile, and blue line depicts the mean. Each sample was run in duplicates. *, P < 0.05; **, P < 0.01; ***, P < 0.001; ****, P < 0.0001 using one-sample Student’s t test.

