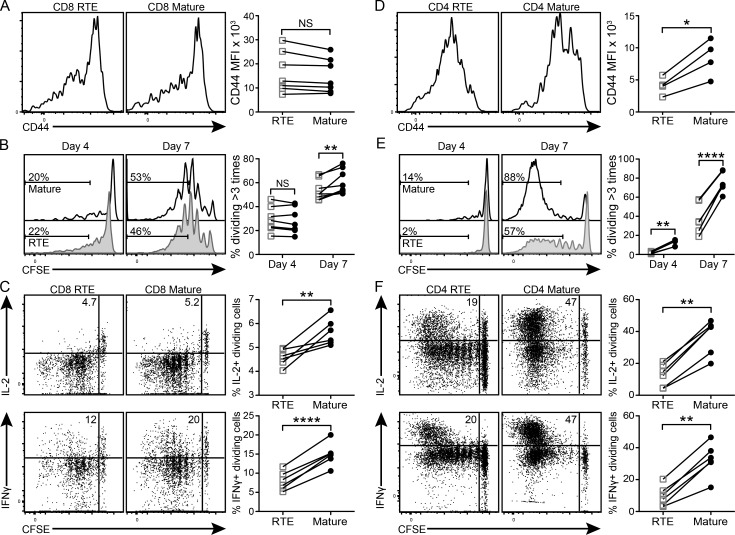
Figure 1.
CD4 and CD8 RTEs proliferate less and secrete less IL-2 and IFN-γ than mature T cells in response to peripheral self-antigen in vivo. (A–C) 106 naive OT-I RTEs and MN T cells were cotransferred into RIP-mOVA Tg hosts. (D–F) 0.5 × 10⁶ naive OT-II RTEs and MN T cells were cotransferred with 2 × 10⁶ bulk naive OT-I T cells into RIP-mOVA Tg hosts. (A and D) Donor cells from the draining pLNs were analyzed 4 d later. Histograms show representative CD44 staining by RTEs and mature T cells. Data in the right panels show CD44 mean fluorescence intensity (MFI) compiled from two independent experiments (n = 4–7). (B and E) Proliferation of donor cells from the pLNs was quantified 4 and 7 d after transfer. Numbers in the histograms represent the percentages of donor RTEs (shaded) and mature T cells (open) that have divided more than three times. Data in the right panels show percentages of donor RTEs (open squares) and mature T cells (filled circles) dividing more than three times compiled from two independent experiments (n = 4–8). (C and F) 7 d after transfer, cells from recipient pLNs were restimulated in vitro for 5 h and stained for intracellular cytokines. Numbers in the top left dot plot quadrants represent the percentages of IL-2+ or IFN-γ+ dividing donor cells. Data in the right panels are compiled from two independent experiments (n = 6–8). *, P ≤ 0.05; **, P ≤ 0.01; ****, P ≤ 0.001, using a paired Student’s t test.

