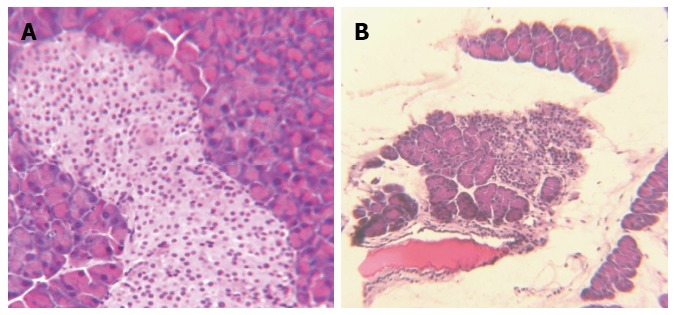
Figure 5.

Pancreatic photomicrographs from sham-treated normal control (A) compared to dibutyltin dichloride-treated animal (B). A: Pancreas: Photomicrograph demonstrates sham-treated control pancreas with normal pancreatic microstructure and islet cells. Representative slide from n = 8 animals/group; B: Pancreatitis: Photomicrograph illustrates pancreas from a dibutyltin dichloride-treated animal with significant loss of pancreatic structure and islets, acinar atrophy, infiltration of inflammatory cells, fatty deposits and edema (magnification × 40). Representative slide from n = 8 animals/group.
