Fig. 1.

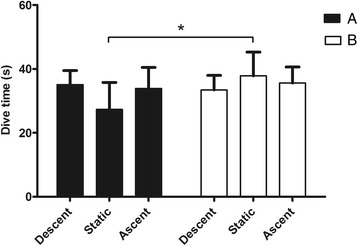
Comparison between durations of the 3 phases (descent, static and ascent) of the protocol after breakfast (a) and fasting (b). Values are mean ± SD. Asterisk (*) indicates P < 0.05 vs. corresponding time point of static

Comparison between durations of the 3 phases (descent, static and ascent) of the protocol after breakfast (a) and fasting (b). Values are mean ± SD. Asterisk (*) indicates P < 0.05 vs. corresponding time point of static