
Fig. 3.
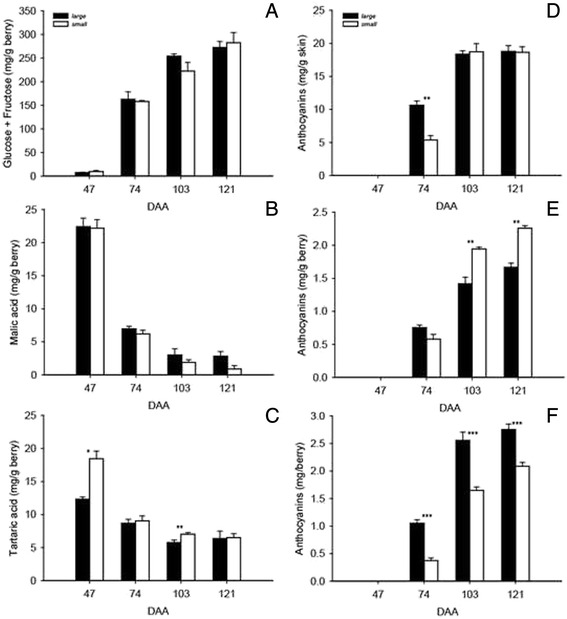
Berry composition. (a) Glucose + fructose, (b) malic acid, and (c) tartaric acid concentration, expressed as mg/g berry, in small and large berries at 47, 74, 103, and 121 DAA. Anthocyanin levels expressed as (d) mg/g skin, (e) mg/g berry, and (f) mg/berry in small and large berries at 47, 74, 103, and 121 DAA. Means and standard errors are reported for each berry group at each sampling. *, **, and *** indicate level of significance of P < 0.05, P < 0.01, and P < 0.001, respectively