
Fig. 5.
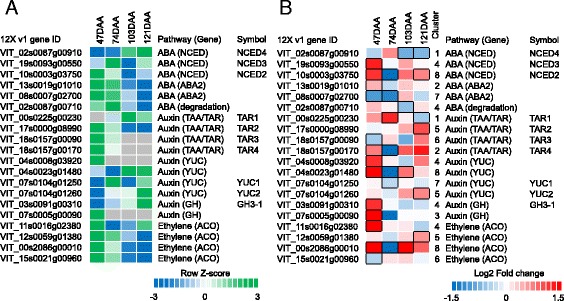
Evolution during development and fold change between small and large berries of abscisic acid (ABA), auxin, and ethylene genes differentially expressed at 47, 74, 103, and 121 DAA. (a) Evolution, based on the mean log2 (FPKM + 1) of small and large berries, and (b) log2 fold (small/large) changes. The relative log2 (FPKM + 1) values registered in small and large berries on average during berry development in a are depicted by green (high expression) and blue (low expression). Grey color indicates the absence (or low levels) of detectable transcripts at the corresponding stage. Blue and red colors in b indicate downregulated and upregulated transcripts, respectively, in small berries in relation to large berries. Boxes with bold margins indicate significant differences (adjusted P-value <0.05) between berry size treatments at a given developmental stage. The cluster column in b indicates the cluster number the associated transcript belongs to NCED, 9-cis-epoxycarotenoid dioxygenase; ABA2, xanthoxin dehydrogenase; TAA/TAR, TRYPTOPHAN AMINOTRANSFERASE OF ARABIDOPSIS1/TRYPTOPHAN AMINOTRANSFERASE RELATED (TAA1/TAR); YUC, YUCCA; GH, IAA-amido synthetase; ACO, 1-aminocyclopropane-1-carboxylic acid oxidase