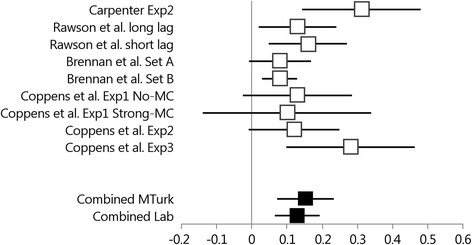
Fig. 2.

Forest plot of the 95 % confidence intervals of the mean testing advantage (final test proportion correct for tested pairs – final test proportion correct for restudied pairs) obtained with mediator final test cues for the Lab experiments (Carpenter Exp2 through Brennan et al. Set B) and the MTurk experiments (Coppens et al. Exp1 No-Mc through Coppens et al. Exp3). The combined estimates for the Lab Experiments and the MTurk experiments and the 95 % confidence intervals are also presented
