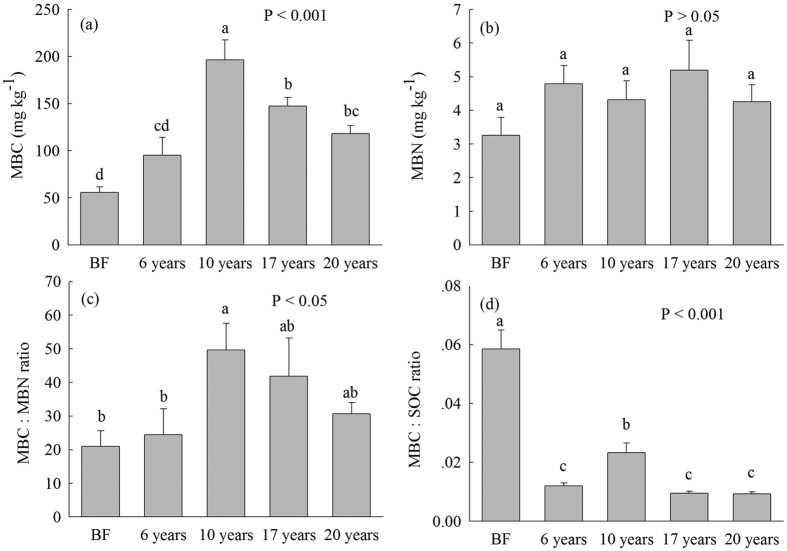
Figure 1.
(a) Soil microbial biomass carbon (MBC), (b) Soil microbial biomass nitrogen (MBN), (c) MBC:MBN ratio and (d) MBC:SOC ratio (mean ± SE, n = 9) in bare flat (BF) and different invasion times (6, 10, 17 and 20 years) of S. alterniflora soils (0–30 cm depth). Different lower case letters over the bars indicate statistically significant differences at α = 0.05 level across the S. alterniflora invasion chronosequence.

