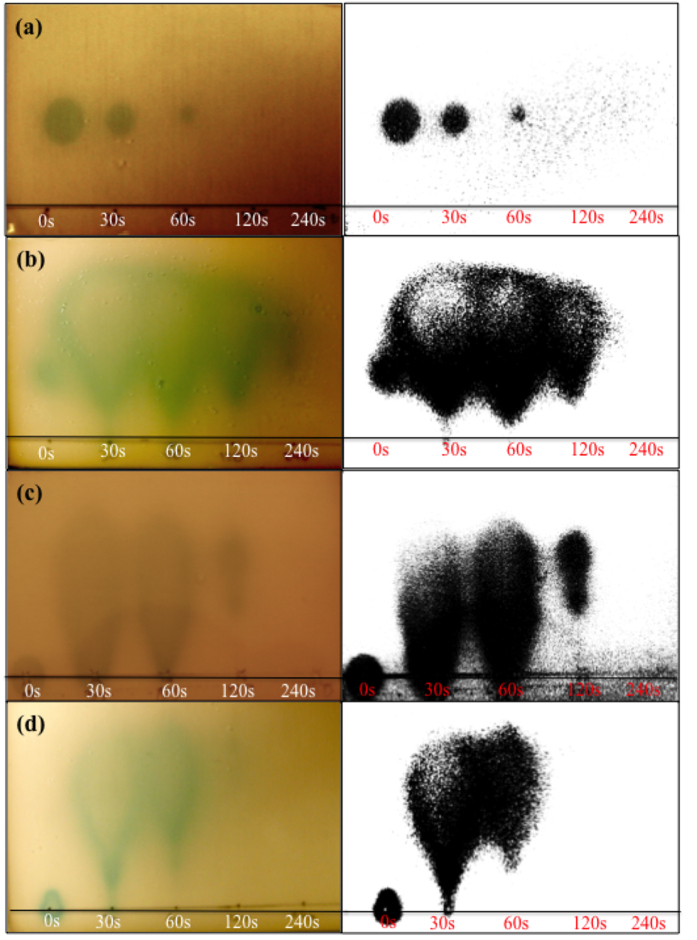
Figure 3. A. tumefaciens ATCC BAA-2240 TLC-overlay showing the effect of plasma exposure on AHL mobility and activity.
(a) BHL, (b) HHL, (c) OHL and (d) OdDHL. Each AHL was exposed for 0 (positive control), 30, 60, 120 and 240 seconds. Corresponding images show original image subjected to thresholding for clarity of presentation (Image J). 1 μl of 100 μM AHL was spotted, ran and overlaid as described in materials and methods. Plates were incubated at 28 °C for 48 hours.

