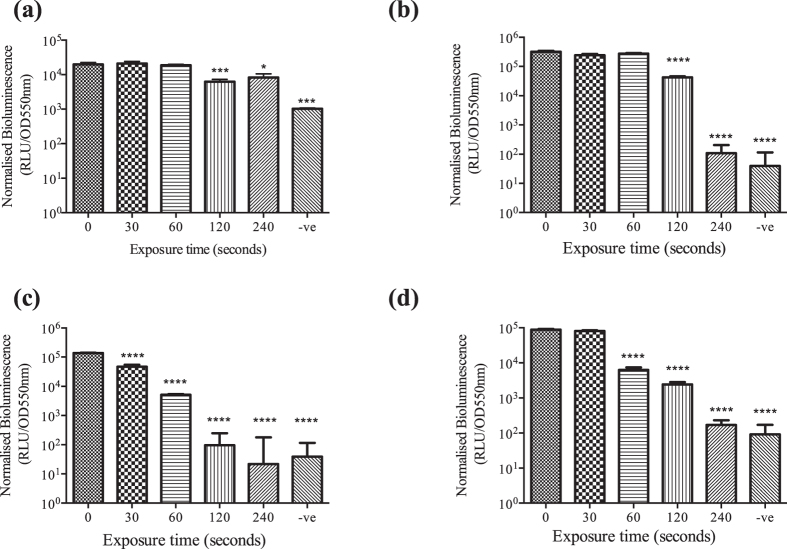
Figure 4.
Normalised bioluminescence after 5 hours growth for bioluminescence reporters E. coli pSB536 (a) BHL (10 μM) incubated at 30 °C, E. coli pSB401 for plasma treated (b) HHL (10 μM), (c) OHL (10 μM) and E.coli pSB1142 for plasma treated (d) OdDHL (10 μM) incubated at (37 °C) for 14 hours. Bioluminescence plateaued after 4 hours, increasing proportionally to growth of E. coli (S1) Each AHL was plasma treated for 0, 30, 60, 120, 240 seconds and reporter strain only (−ve). Error bars represent the standard deviation of five replicates. One way ANOVA with post hoc Dunnett’s multiple comparisons test compared to 0 seconds was used for statistical analysis. ****p value < 0.0001.

