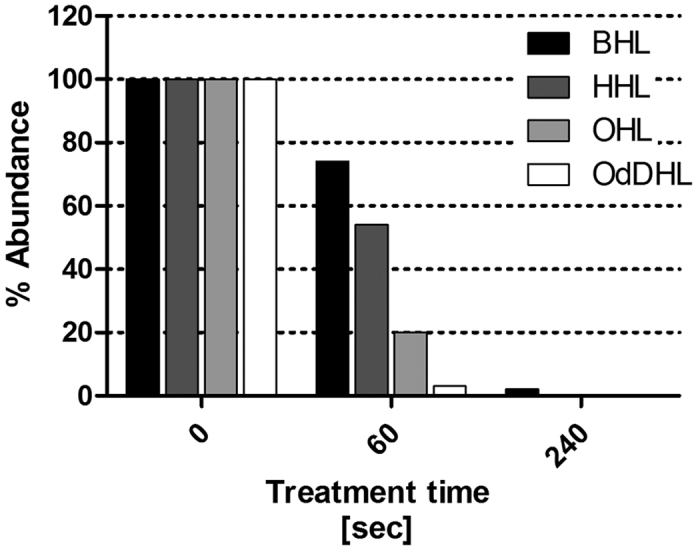
Figure 8. Plasma exposure time-dependent degradation of AHL parent molecules; abundance of the analytes peaks following plasma treatment based on the UHPLC-MS analysis.

The bars represent the absolute response of the analyte, measured as peak area.

The bars represent the absolute response of the analyte, measured as peak area.