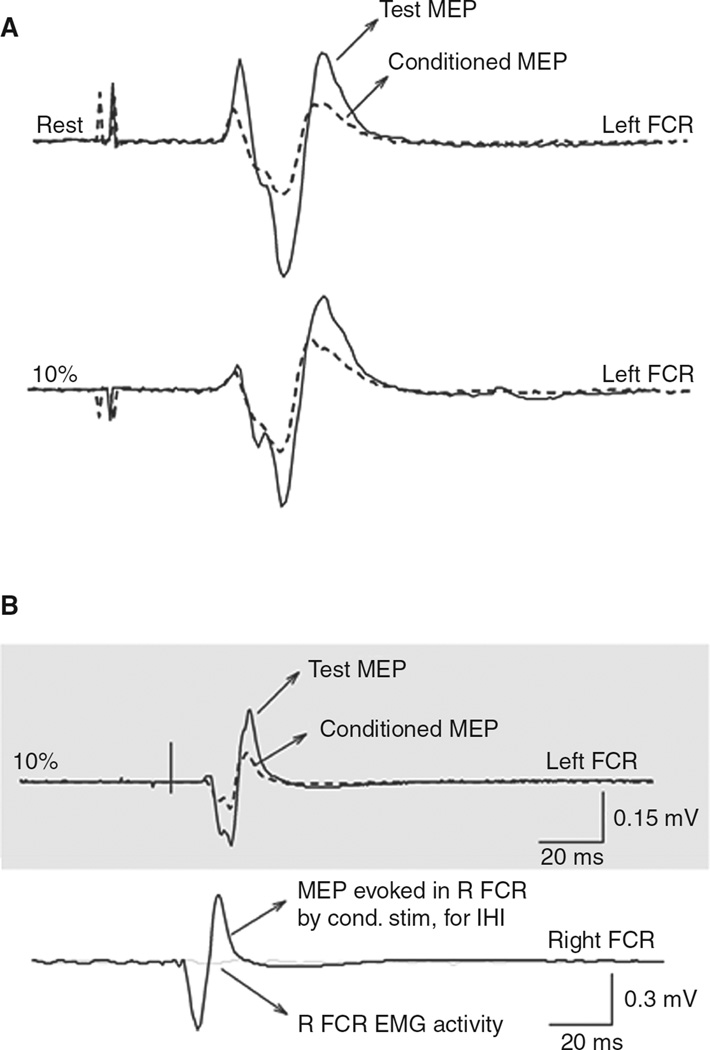
Figure 2.
Short-interval intracortical inhibition (SICI) and interhemispheric inhibition (IHI) measurements. (A) SICI measured in the left flexor carpis radialis (FCR) in a representative subject when the right FCR was at rest or performing 10% of maximal right wrist flexion force. Solid lines indicate test motor-evoked potentials (MEPs); dashed lines indicate conditioned MEPs. The conditioning subthreshold pulse was given 2.5 ms earlier than the test pulse. Note the well-defined SICI at rest and 10% of maximal right wrist flexion force. (B) IHI from the left M1 to the right recorded from the left FCR of a representative subject during performance of 10% of maximal right wrist flexion force. Solid lines indicate test MEPs; dashed lines indicate conditioned MEPs. The conditioning suprathreshold pulse was given 10 ms earlier than the test pulse. Recordings from the right FCR are shown to demonstrate with solid lines the MEP evoked by the conditioning stimulus (for eliciting IHI) and in light gray solid lines the raw EMG activity in the right FCR at the time of application of the test stimulus alone. Note the well-defined IHI at 10% of maximal right wrist flexion force. Modified, with permission, from Perez MA, Cohen LG. Mechanisms underlying functional changes in the primary motor cortex cortex ipislateral to a moving hand. J Neurosci. 2008;28: 5631–5640. Copyright © 2008 by Elsevier.

