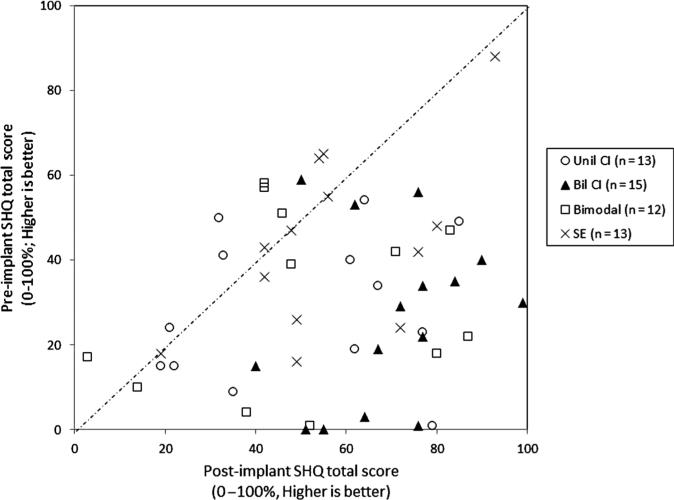
Figure 5.
Individual pre- and postimplant SHQ total scores for the CI subjects. Scores are shown for unilateral (open circles, n = 13), bilateral (filled triangles, n = 15), bimodal (open squares, n = 12), and short-electrode (Xs, n = 13) users. Postimplant scores are shown along the x-axis, and preimplant scores are shown along the y-axis. Scores to the right of the dashed line indicate lower preimplant and higher postimplant SHQ scores, and scores to the left of the dashed line indicate higher preimplant and lower postimplant scores.

