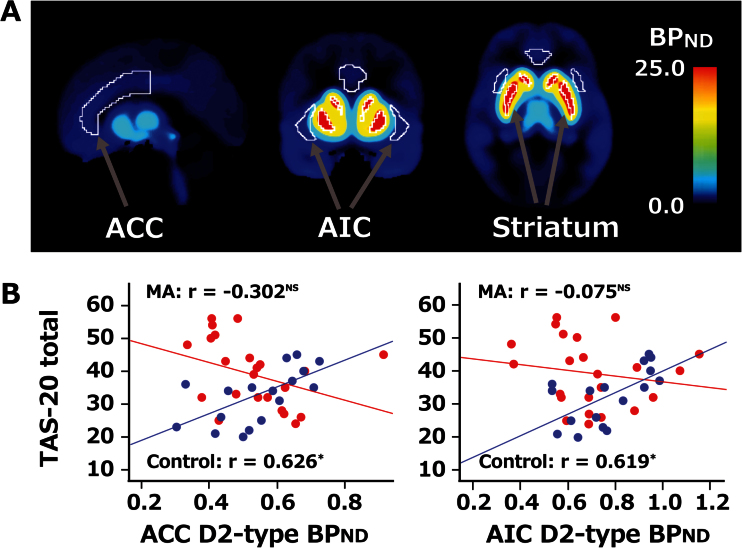
Figure 1.
D2-type receptor binding potential (BPnd) and association with Toronto Alexithymia Scale (TAS-20) total score. (a) Volumes of interest (VOIs) of the anterior cingulate cortex (ACC), anterior insular cortex (AIC), and striatum are shown on an averaged BPnd map of the control group (n=17). VOIs outlined in white. MNI coordinates: x=90, y=135, z=75 (mm). (b) Scatterplots showing individual data for the TAS-20 total score and BPnd in ACC and AIC. Blue circles represent data from individual participants in the control group, and red circles represent data from the MA group. BPnd was corrected for age, sex, smoking. Partial correlation analysis was used to determine r-values (*P < .05, NS nonsignificant, with P values not corrected for multiple-region comparisons).

