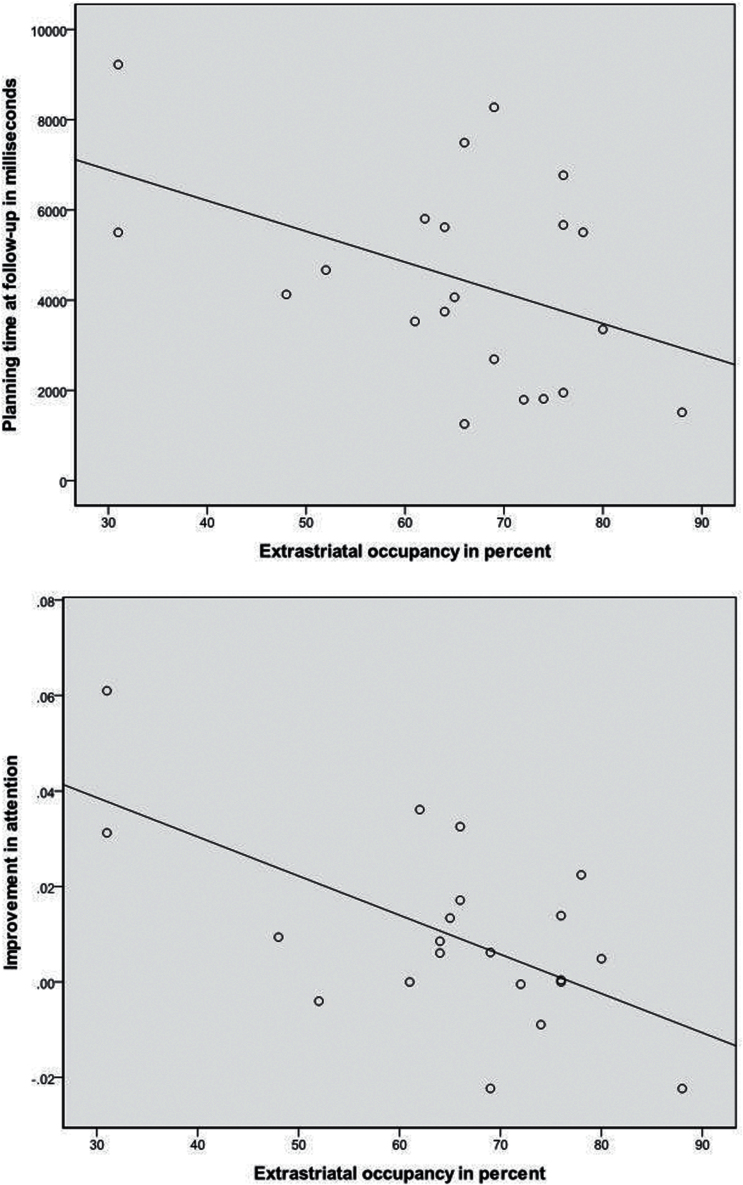
Figure 4.
Scatter plots showing correlations between extrastriatal dopamine D2/3 receptor occupancy and cognitive measures. (A) Planning time at follow-up measured with CANTAB (Stockings of Cambridge initial thinking time) (n = 21, r = -0.436, P=.048). Extrastriatal occupancy is in percent, planning time in msek. (B) Improvement in attention measured with CANTAB (signal detection measure A’ from the Rapid Visual Information Processing test) (n = 21, r = -0.615, P=.003). Occupancy is in percent, and attention scores range from 0 to 1, with 1 indicating optimal signal detection.

