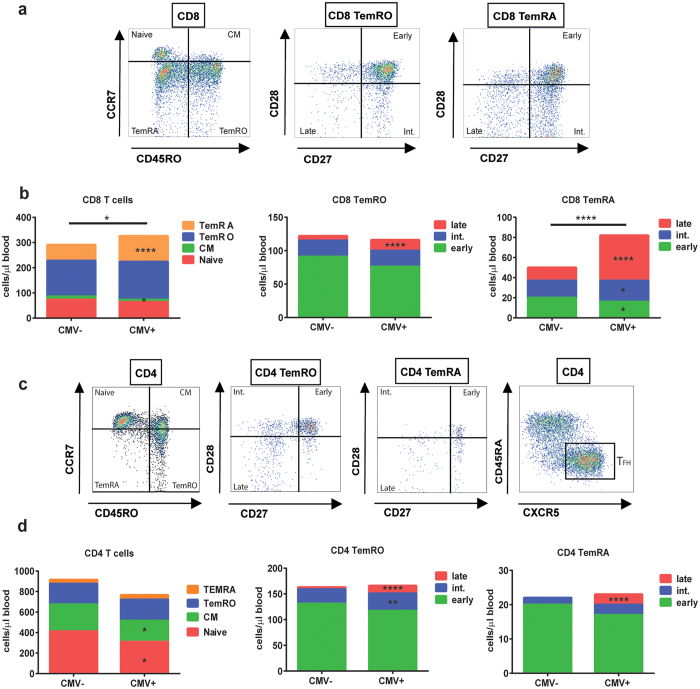
Figure 1. Effect of CMV on the CD8 and CD4 T-cell lineages.
(a) Gating strategies for the CD8 T-cell subsets. A representative example is shown. (b) A cumulative schematic overview of the geometric mean values of absolute numbers of CD8 naive, CM, TemRO, and TemRA cells in CMV− and CMV+ participants. TemRO and TemRA cells are split into early, intermediate, and late differentiation subsets. (c) Gating strategies for the CD4 T-cell subsets. A representative example is shown. (d) A cumulative schematic overview of the geometric mean values of absolute numbers of CD4 naive, CM, TemRO, and TemRA cells in CMV− and CMV+ participants. TemRO and TemRA cells are were split into early, intermediate, and late differentiated subsets. The Mann Whitney U test was used for statistical analysis. *p < 0.05, **p < 0.01, ****p < 0.0001 (n = 250).

