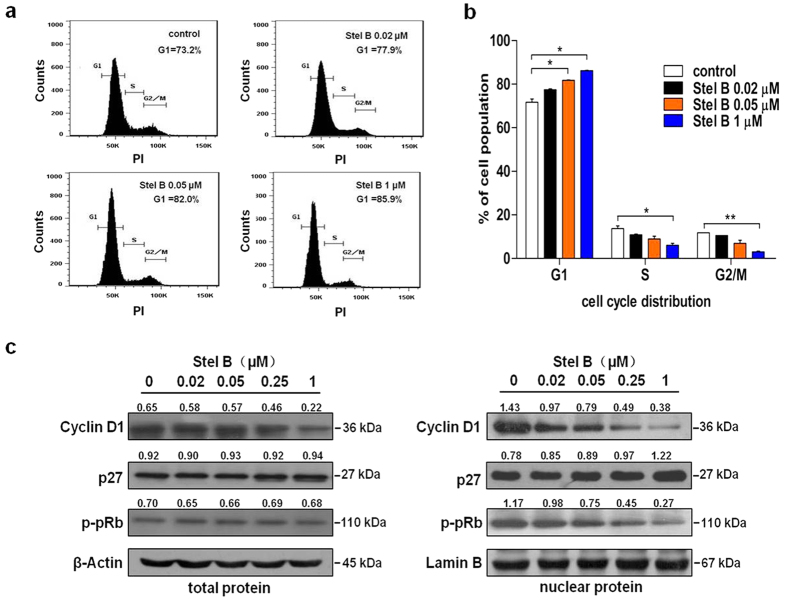
Figure 2. Stel B induced cell cycle arrest at G1 phase in A549 Cells.
(a) Cell cycle distribution analysis by flow cytometer. A549 cells were incubated with indicated concentrations of Stel B for 24 h. The cells were collected, stained with PI and analyzed by flow cytometer. (b) The percentage of cell population at G1, S, and G2/M phases. Data are mean ± SD, representative of three independent experiments (n = 3). *p < 0.05, **p < 0.01, compared with the respective controls. (c) Effect of Stel B treatment on cell cycle-related proteins. A549 cells were treated with Stel B (0, 0.02, 0.05, 0.25, 1 μM) for 24 h. The levels of cyclin D1, p27, and p-pRb in total protein (left panel) as well as in nuclear protein (right panel) were determined by western blot.

