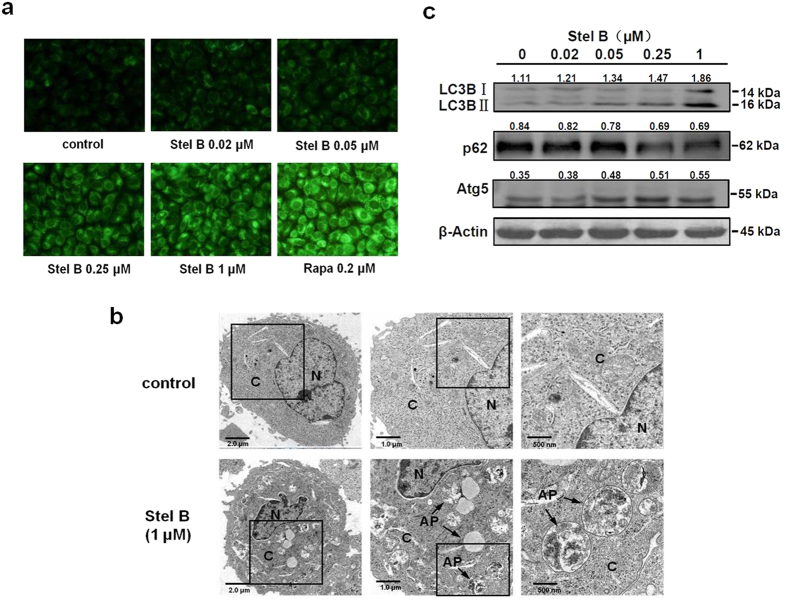
Figure 5. Stel B induced autophagy in A549 cells.
(a) Fluorescence microscopy with MDC staining. A549 cells were treated with Stel B (0, 0.02, 0.05, 0.25, 1 μM) or 0.2 μM rapamycin (Rapa) for 24 h and then stained with MDC. The acidic vesicles were observed under a fluorescence microscope. MDC-stained vacuoles increased in Stel B or Rapa-treated cells, compared with those without treatment. (b) Transmission electron microscopy (TEM). A549 cells were cultured with or without 1 μM Stel B for 24 h and then subjected to TEM analysis. Autophagosomes (AP) are indicated in Stel B-treated A549 cells. Bars = 2.0 μm (left panel), 1.0 μm (middle panel) and 500 nm (right panel), respectively. N: nucleus; C: cytoplasm; AP: autophagosomes. (c) Western blot analysis of the levels of LC3B, p62 and Atg5 proteins. A549 cells were treated with Stel B (0, 0.02, 0.05, 0.25, 1 μM) for 24 h, and the expression levels of LC3B, p62, Atg5 and β-actin were determined by western blot.

