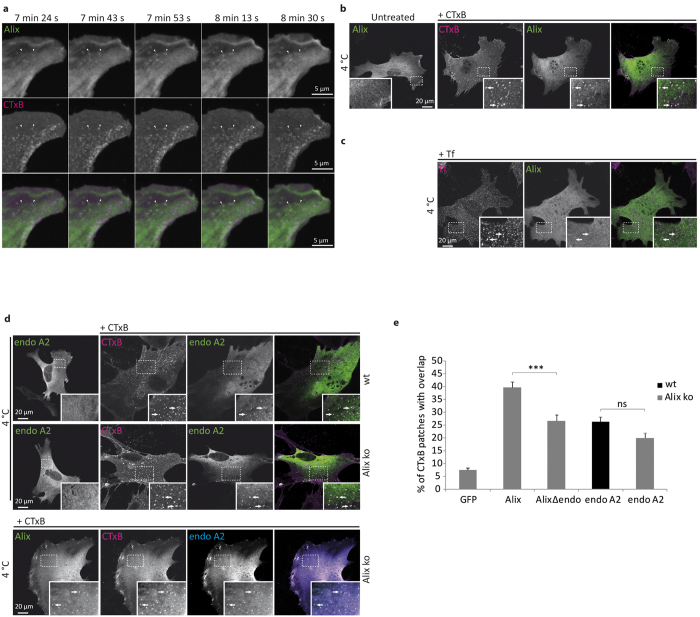
Figure 5. Alix and endophilin A2 relocalise to CTxB labeled membrane patches.
(a) Images from time-lapse video microscopy, acquired by spinning-disk confocal microscopy of an Alix ko MEF expressing GFP-Alix 5 min after addition of CTxB-TRITC. Arrows indicate GFP-Alix (green) recruitment at the level of preexisting (right) or appearing (left) CTxB labeled patches (magenta). Both arrows show disappearance of CTxB and GFP-Alix. (b) Recruitment of Alix (green) to CTxB patches (magenta). Alix ko MEFs expressing GFP-Alix were left untreated, or incubated for 20 min with CTxB-TRITC at 4 °C prior to fixation. (c) Alix (green) is not recruited to membrane patches containing TfR (magenta). Alix ko MEFs expressing GFP-Alix were incubated for 20 min with Tf-TRITCat 4 °C prior to fixation. (d) Upper panels: Endophilin A2 recruitment to CTxB patches in both wt and Alix ko cells. wt MEFs and Alix ko MEFs expressing Myc-endophilin-A2 (endo A2), were left untreated, or incubated with CTxB-TRITC for 20 min at 4 °C before fixation and immunostaining with anti-Myc antibodies. Lower panel: Endophilin A2 (blue) and Alix (green) colocalize to CTxB patches (magenta). Alix ko MEFs expressing GFP-Alix and Myc-endophilin were incubated with CTxB-TRITC for 20 min at 4 °C before immunolabeling with anti-Myc antibodies. The image on the right shows the 3-color merge. Arrows indicate representative patches containing all 3 proteins. (e) Graph showing the percentage of CTxB labeled patches colocalizing with GFP, GFP-Alix, Flag-AlixΔendo or Myc-endophilin-A2 in wt (black) or Alix ko cells (gray). Quantification was performed using ImageJ (Number of cells in 3 independent experiments: GFP, n = 31; Alix, n = 53; AlixΔendo, n = 43; endoA2, n = 57 for wt and n = 56 for Alix ko. ***P < 0.001, one way ANOVA and Dunett’s test).

