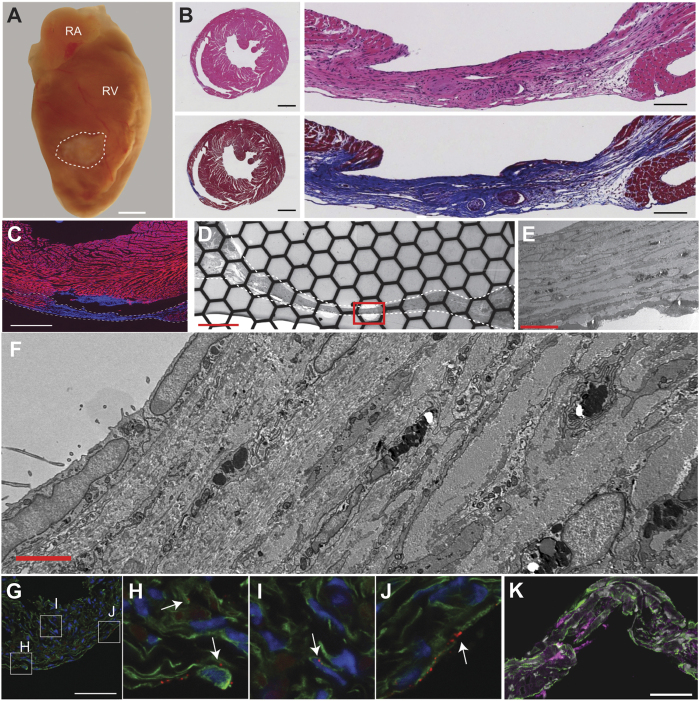
Figure 1. Histology and ultrastructure of ventricular scars.
(A) Gross image of an injured heart (dotted line indicates scar border). RA, right atria; RV, right ventricle; bar = 1 mm. (B) Hematoxylin and Eosin and Masson’s Trichrome stained sections, top and bottom respectively. Cross section of heart at the level of the scar and magnified region showing scar, left and right respectively. Left bar = 1 mm, right bar = 100 μm. (C) Phalloidin (red) and DAPI (blue) staining of section including scar (dotted line), bar = 1.0 mm. (D–F) Transmission electron microscopy of a scar at different magnifications showing the cellular composition. (E) Enlargement of the area within the red box in D. (F) Enlargement of the area within the red box in E. Bar = 200, 10 and 2 μm, (D–F) respectively. (G) Immunohistochemistry of the scar shows abundant vimentin-positive cells (green), and punctate Cx43 signal (red). Bar = 50 μm. (H–J) Magnified image of boxes indicated in panel (G). (K) Section co-stained for vimentin (green) and β-galactosidase (magenta). Bar = 50 μm.

