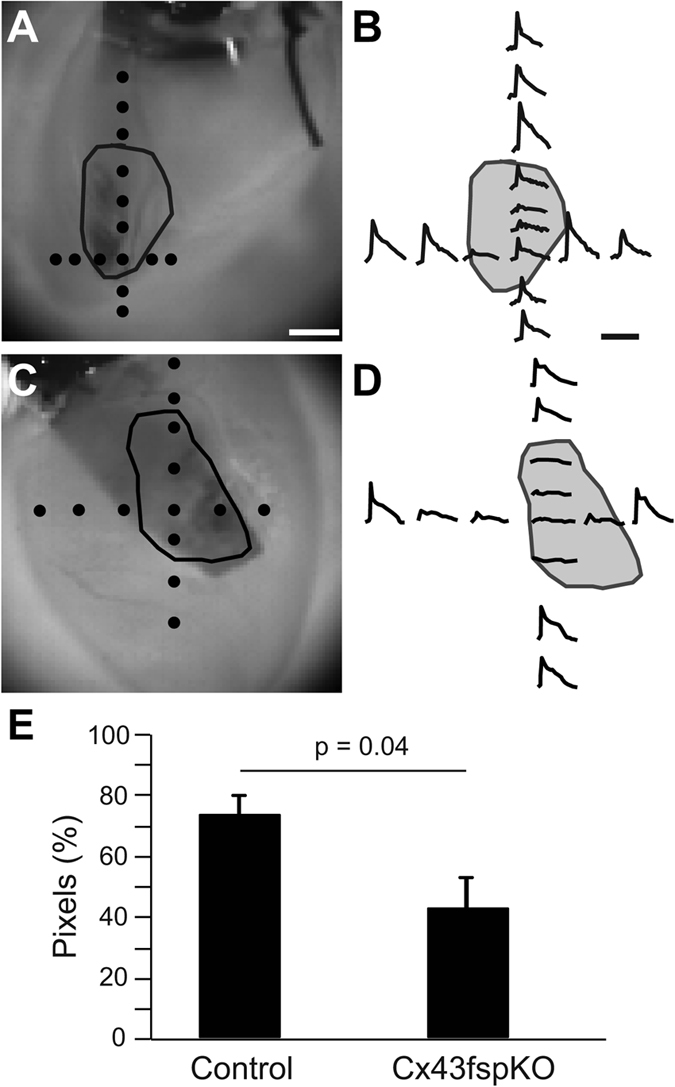
Figure 2. Electrotonic coupling between myocytes and non-myocytes in scars.

(A,C) Brightfield images of RV free wall of a control and Cx43fsp1KO heart, respectively. Scar perimeter is indicated by the black line. Black dots indicate the location of the pixel traces shown on the right. Bar = 1 mm. (B,D) Individual pixel traces. Pixel amplitudes were normalized to the largest pixel amplitude on the RV free wall. Bar = 60 ms. (E) Chart shows the percentage of pixes within the scar region with signal-to-noise ratio greater than twice background levels. n = 6 and n = 7 for Control and Cx43fsp1KO, respectively.
