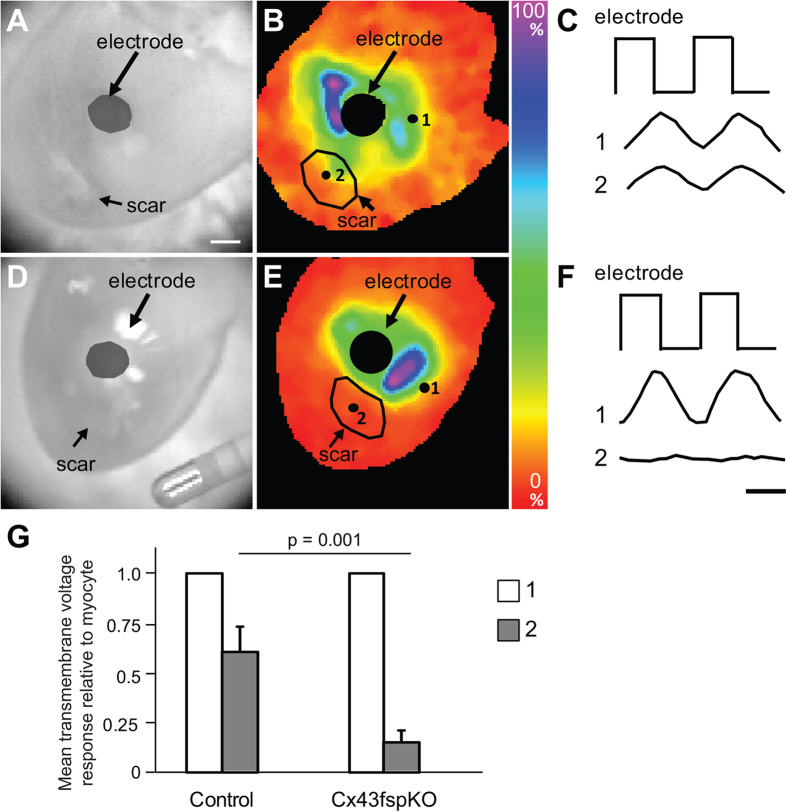
Figure 3. Electrotonic coupling is reduced in Cx43fsp1KO mice.
(A,D) Brightfield images of RV free wall showing the location of the scar and electrode. Bar = 1mm. (B,E) Color map showing maximal voltage amplitude across the epicardial surface for a representative control and Cx43fsp1KO heart, respectively. Measurements were obtained at the peak response to the injected current pulse. Color bar = amplitude normalized to the largest amplitude pixel. (C,F) Voltage response recorded from the myocardium near electrode (1) and the scar (2) of control and Cx43fsp1KO hearts, respectively. (G) Mean relative transmembrane voltage response in the myocardium near the electrode and the scar, normalized to myocyte signal. n = 6 and n = 8 for Control and Cx43fsp1KO, respectively.

