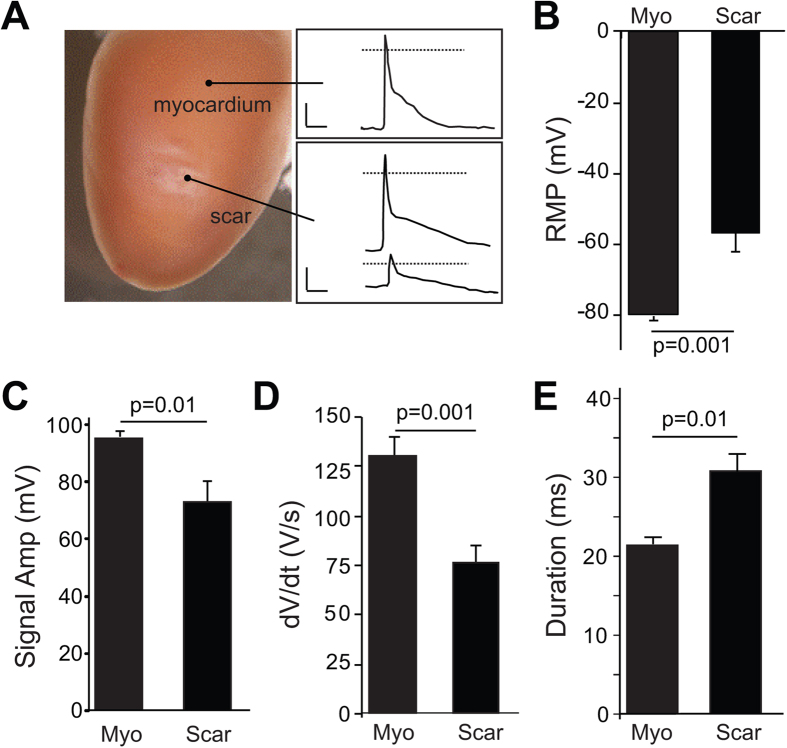
Figure 4. Microelectrode recordings from myocardium and scars.
(A) Representative image (left panel) showing the two regions from which microelectrode recordings were obtained. Representative recordings obtained from the myocardium (right panel, upper box) and scar (lower box). Dotted line indicates 0 mV. Horizontal and vertical bars = 10 ms and 25 mV, respectively. (B–E) Average resting membrane potential (RMP), maximal signal amplitude, upstroke velocity (dV/dt), and signal duration at 70% repolarization, respectively. Data were obtained from n = 6 hearts. Average values were obtained for the myocardium and scar of each heart from a total of 4–18 impalements in each area.

