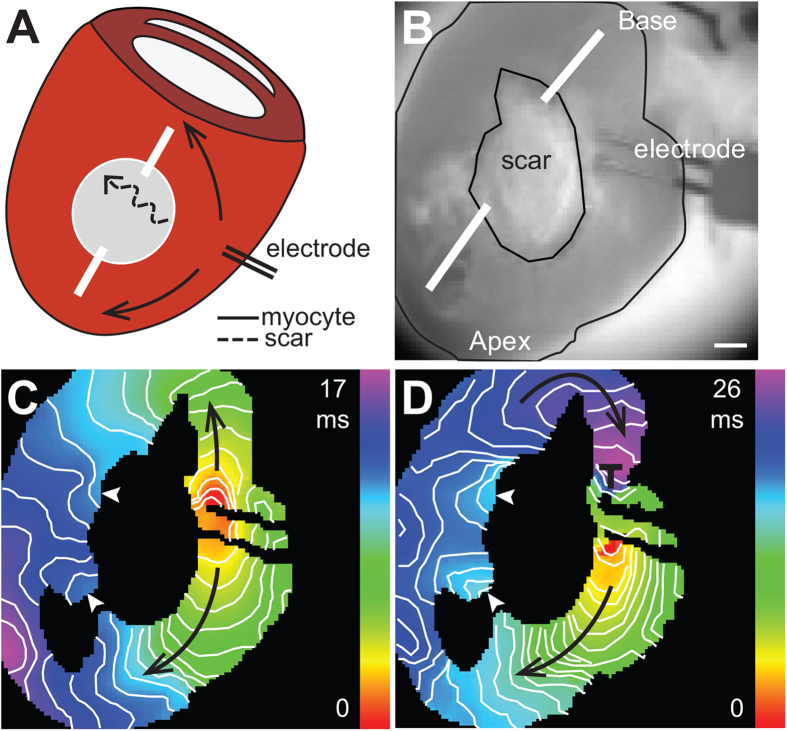
Figure 6. Electrotonic conduction across scars.
(A) Schematic diagram of cryoinjury model showing transmural incisions and conduction pathways. Action potentials generated in the region proximal to the scar can be propagated to regions distal to the scar through active conduction through the myocyte pathway (myocyte), or by passive spread of current through the scar pathway (scar). (B) Brightfield image showing the location of the scar and pacing electrode. White lines show location of transmural incisions. Bar = 1 mm. (C,D) Activation maps of the S1 and S2 paced beats, respectively. S1 drive cycle was 100 ms; S2 was delivered 70 ms after the S1 beat. White arrowheads indicate the sites of earliest activation on the distal side of the scar. Black arrows indicate the direction of propagation. Region of conduction block is indicated by ┬. Isochronal lines are drawn every 1 ms.

