
FIGURE 3.
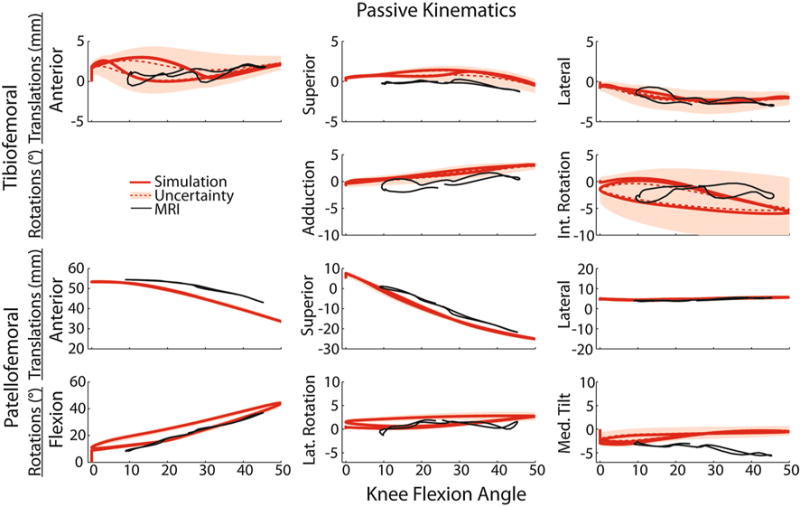
Forward dynamic simulations of passive knee flexion–extension (solid red line) compared with subject-specific dynamic MRI measurements (solid black line). Shaded regions represent Monte Carlo simulation results (red dotted line = mean; shaded region = one standard deviation) obtained by accounting for uncertainty in ligament stiffnesses and reference strains. The effect of ligament uncertainty was directionally dependent, with the greatest variability seen in tibiofemoral translations, internal tibial rotation and medial patellar tilt.