
FIGURE 6.
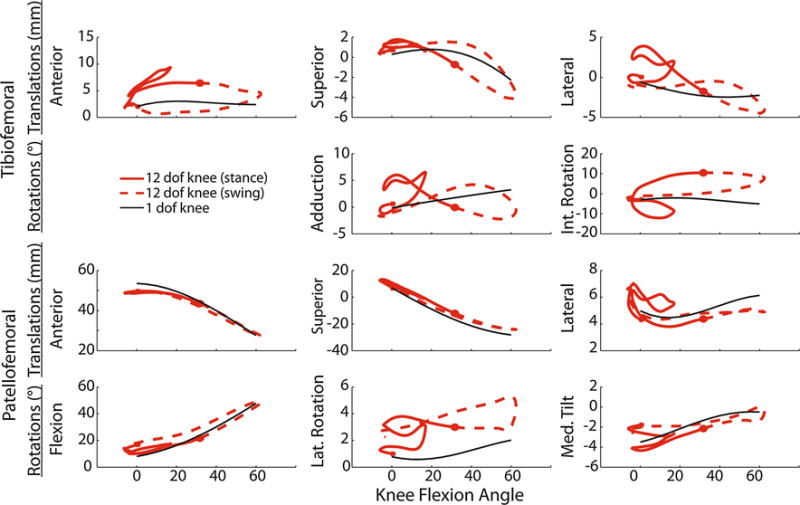
Plots of the predicted tibiofemoral and patellofemoral kinematics (solid red = stance, dashed red = swing) vs. knee flexion over a walking gait cycle. For many of the degrees of freedom (e.g., anterior tibial translation, internal tibial rotation), there are substantial variations in the predicted kinematics and that assumed when describing secondary tibiofemoral kinematics and patellofemoral kinematics as a constrained function of knee flexion (solid black line).