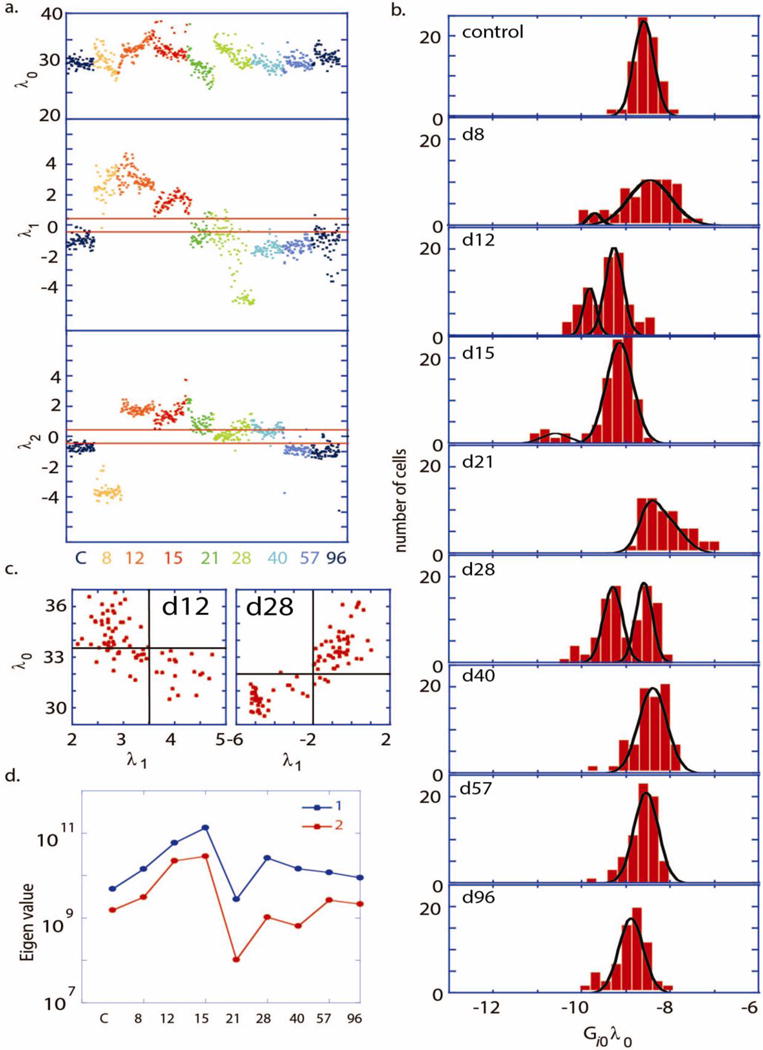
Figure 3. Analysis of single cell data through the CiC transition.

a. The weight of the steady state term ( ) and the first two constraints ( and ) plotted, for each cell and color-coded for each time point. b. Number of cells vs. , with different panels shown at different time points shown for the pS6K protein. Comparable distributions are obtained for other measured proteins since are similar (Supplementary figure S7). The distribution (b) at every time point was fitted to either unimodal or Bimodal Gaussian distributions. Bimodal Gaussian distributions appear as the best fitting distribution for the days 12, 15 and 28 (R2 >0.95), whereas unimodal Gaussian is the best fit for the control, d57 and d96 (R2 >0.95). c. Scatter plots of values vs at the day 12 and day 28. The unbalanced process has higher significance, , (as indicated by at the day 12 or at the day 28) in the cell subpopulations with lower protein abundance, as represented by lower values of . d. Principle eigenvalues (1 and 2) of the covariance matrix are plotted as a function of t.
