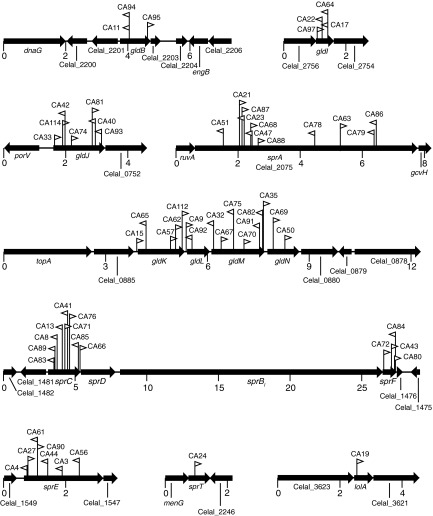
FIG 2.
Maps of the HimarEm1 insertion sites in C. algicola motility mutants. The numbers below the maps refer to kilobase pairs of sequence. Orientations of HimarEm1 insertions are indicated by the triangles. Triangles pointing to the right indicate insertions with inverted repeat 2 (IR2) on the right side and the kanamycin resistance gene of the transposon reading toward the right.

