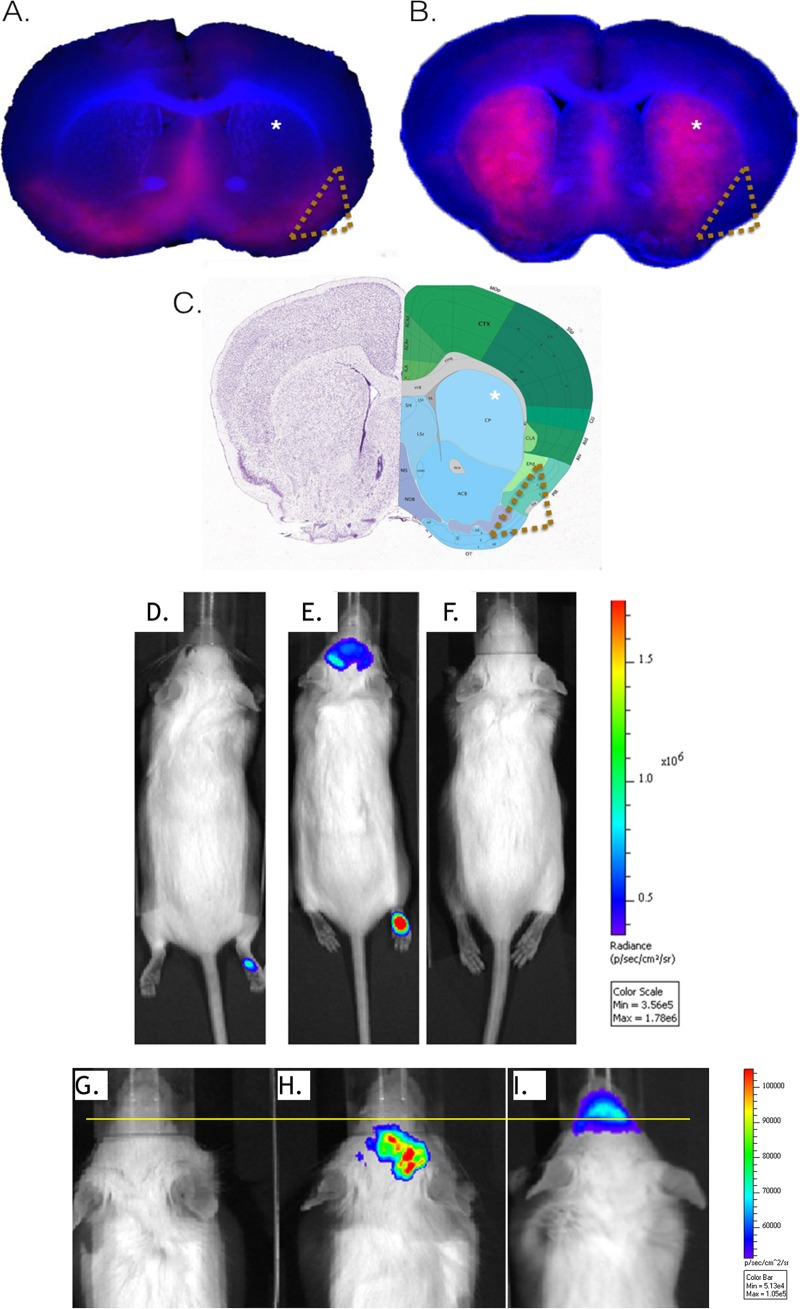
FIG 2.
Routes of inoculation result in distinct expression patterns. The virus distributions in coronal slices of brain from CD-1 mice inoculated via intranasal or subcutaneous administration with McRed virus are shown. At the first sign of neurological disease, 7 dpi for s.c.-inoculated mice and 3.5 dpi for i.n.-inoculated mice, brains were harvested, sectioned into 400-μm coronal slices, and imaged for DsRed expression using fluorescence microscopy. Brain sections were imaged at a total magnification of ×20 for McRed (red) and nuclear counterstain (blue). Distinctive patterns of virus distribution were observed among the brains receiving virus i.n. versus s.c. Representative images show two comparable coronal sections of whole brain from animals receiving either intranasal (A) or subcutaneous (B) inoculation with McRed virus. Distinct patterns of virus distribution are marked within the caudoputamen (indicated with asterisks) and lateral olfactory tract (indicated with gold triangles). (C) An Allen Brain Atlas diagram of comparable coronal section is provided for reference. For definitions of abbreviations, see http://mouse.brain-map.org. (D to I) Whole-animal imaging showing CNS infection with McFire following footpad inoculation. CD-1 mice were inoculated in the footpad with 104 PFU of McFire virus and imaged daily for BLM activity (5 dpi shown). (D) Representative image shows a CD-1 mouse with no neurological signs of disease or BLM in the CNS but having detectable luciferase activity at the inoculation site. (E) Mouse with neurological signs of disease and luciferase activity within the brain region and inoculation site. (F) Uninfected control mouse. (G, H, and I) Magnified views of the head region, using the setting for the narrowest field of view, of uninfected (G), s.c.-inoculated (H), and i.n.-inoculated (I) animals. The images in panels G and H show the animal at 1 day prior to showing neurological signs of disease and required euthanasia, 5 dpi for s.c.-inoculated and 2 dpi for i.n.-inoculated animals. The yellow line is provided to allow easier visualization of signal originating rostral to the animal's eyes. Areas rostral to the eyes includes the nasal turbinates and olfactory sensory neurons.

