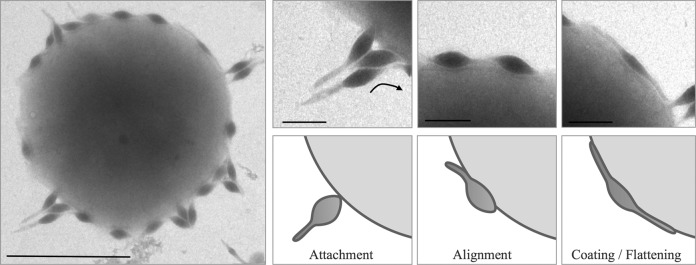
FIG 3.
Electron micrographs of SMV1 interaction with S. islandicus ΔC1C2 cells. Samples were collected at 10 min postinfection and negatively stained for TEM. Left scale bar, 1 μm; right scale bar, 200 nm. The three different virus-host association modes are indicated: attachment, alignment, and coating/flattening.

