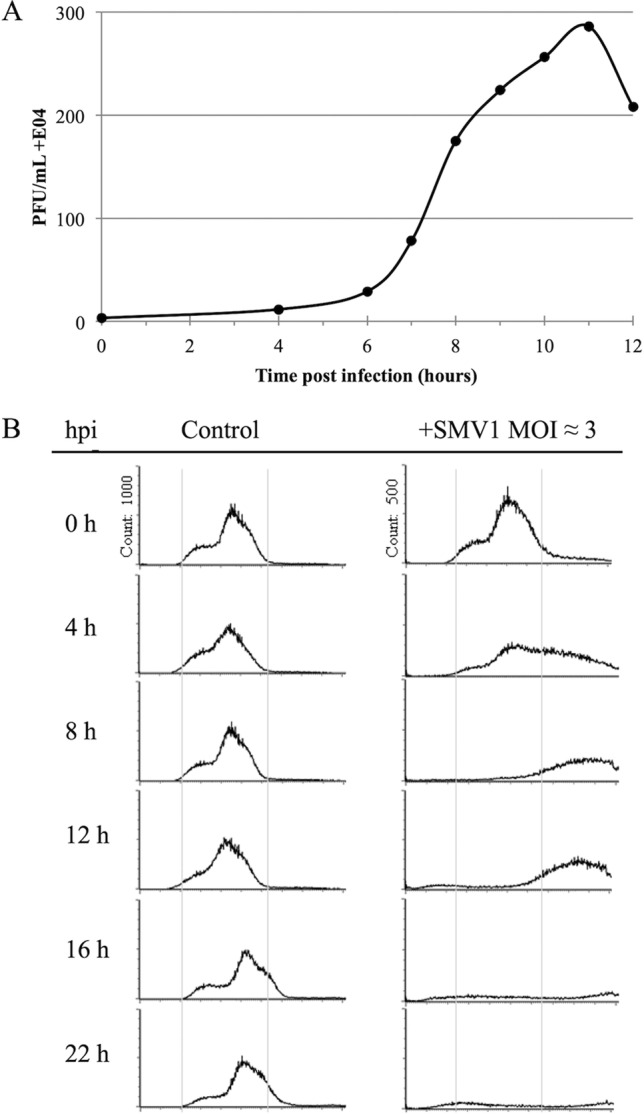
FIG 4.

(A) One-step growth curve of SMV1 infection of S. islandicus ΔC1C2. SMV1 was added at an MOI of about 0.1. The PFU are plotted against time (hours). (B) Flow cytometry time course analysis of S. islandicus ΔC1C2 cells infected by SMV1. Left panel, DNA content distribution from an uninfected culture. Right panel, DNA distribution from a culture infected with SMV1 (MOI ≈ 3). The virus was added just before time point 0 h. The experiment was repeated twice.
