FIG 5.
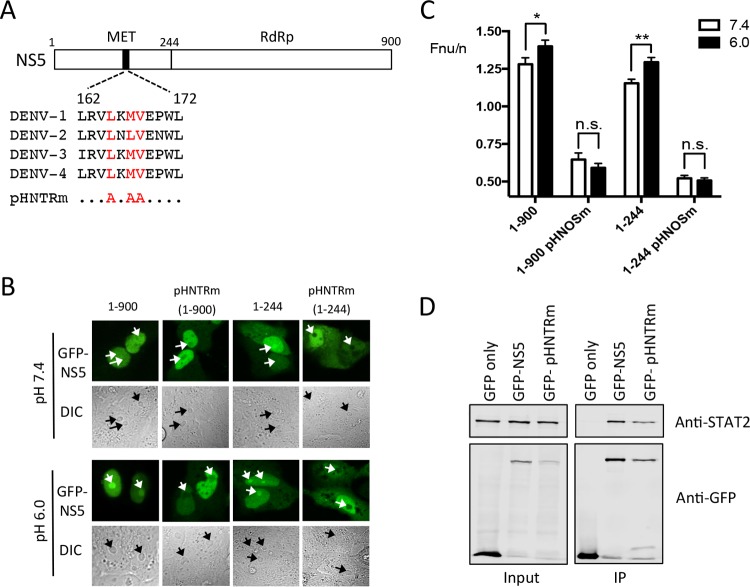
NS5 residues 1 to 244 contain the pH-sensitive nucleolar-targeting region (pHNTR). (A) Schematic diagram of NS5, highlighting a stretch of hydrophobic amino acids predicted to contribute to nucleolar targeting of NS5. (B) CLSM and DIC images (below) of full-length (residues 1 to 900) and truncated (residues 1 to 244) NS5, and corresponding pHNTRm versions (NS5 containing Ala substitutions at Leu-165, Leu-167, and Val-168), fused to GFP, expressed in Vero cells, and imaged live in cell culture medium at the indicated pH. Nucleoli are indicated by white and black arrows in GFP and DIC images, respectively. (C) Results for quantitative analysis for images such as those in panel B. The results represent the means + the SEM, where n > 25. Statistical analysis (by Student t test) was performed using GraphPad Prism software (**, P < 0.01; *, P < 0.05; n.s., not significant). (D) HEK-293T cells transfected to express GFP, GFP-NS5, or GFP-NS5 pHNTRm were lysed 36 h posttransfection and immunoprecipitated (IP) using GFP-trap (ChromoTek). Input or IP samples were probed by Western blotting using mouse anti-GFP (Roche) or rabbit anti-STAT2 (Santa Cruz) antibodies and then imaged using Odyssey infrared imager (LI-COR).

