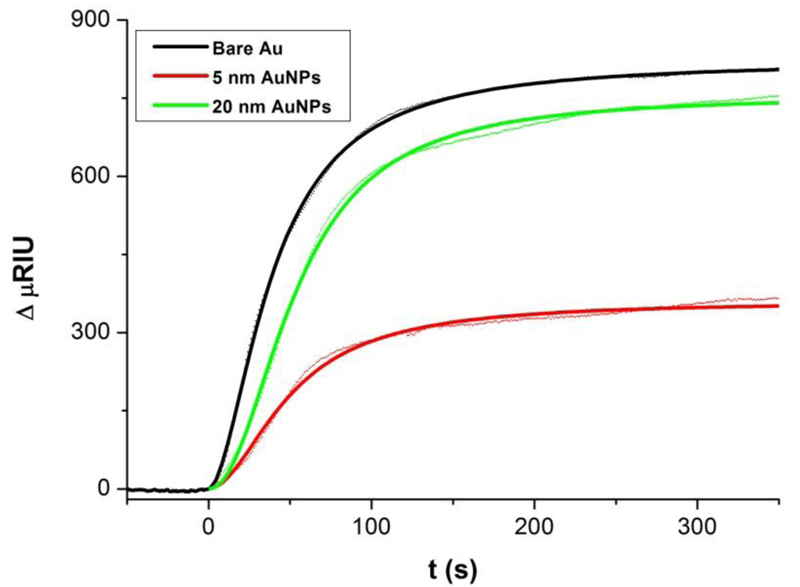
Figure 3.
SPR sensorgram showing formation of a mixed SAM from 1:1 solution of MUA and MH on three different surfaces. The association phase represented by raw data as a thin layer was fitted by a Hill plot (thick line) in order to obtained kinetic constants of the adsorption process (i.e. t1/2 and equilibrium surface coverage Γe).

