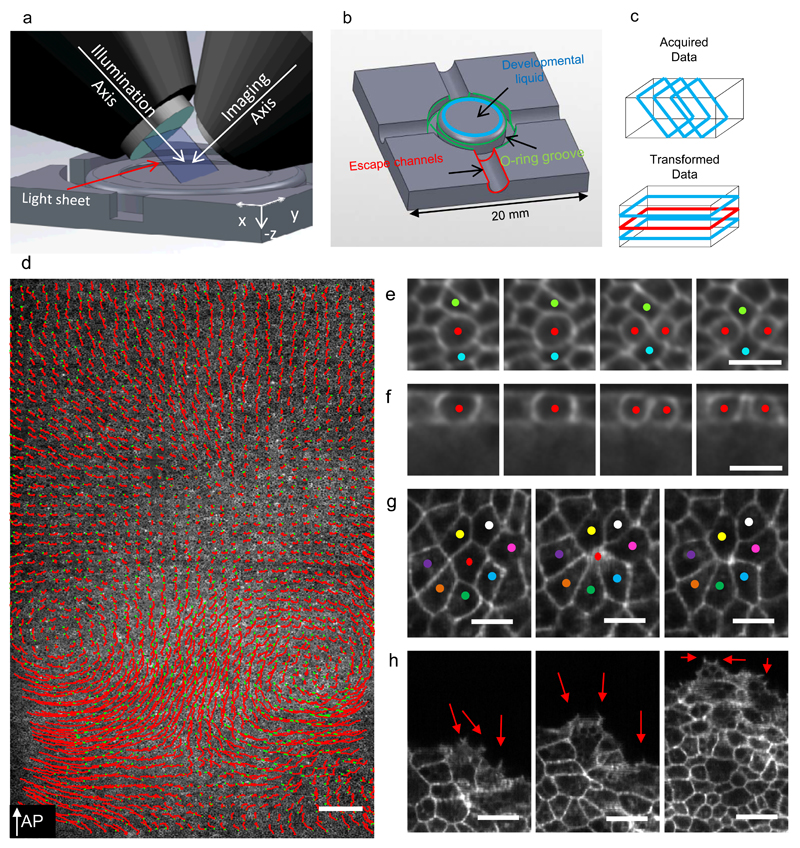
Figure 1. Light-sheet microscopy setup to study gastrulation in chicken embryos.
a-) Schematics of the light-sheet microscope for large flat samples, the illumination and imaging objectives positioned at 45° to the embryo’s surface. Successive 45° cross-sections are collected by moving the embryo through the light-sheet. b-) Sample plate designed to keep the early embryo flat and isolated from external environment. c-) Schematic representations of acquisition geometry (images marked with blue rectangles) and the transformed data for analysis. d-) Single Z plane (red rectangle in C) overlaid with the cell tracks of 5% of all cells over a 180 minute time interval shown as red lines with green dots indicating their final positions (7950×2560 pixels, 5.17mm×1.66mm) (Supplementary Video 1). e-) Four frames 5 minutes apart showing a dividing cell (red dots) and its local neighbourhood shown at full recorded resolution (blue dots) (Supplementary Videos 2,3). f-) Cross-section through the dividing cell seen in E. g-) Three frames 10 minutes apart showing an ingressing cell (red dot, Supplementary Video 4). h-) Three frames 20 minutes apart showing embryo expansion driven by Area Opaca boundary cells making active protrusions (red arrows). The AP arrow in D indicates the direction of the anterior posterior axis, the white scale bar in D is 200 µm. The white scale bars in E, F, G and H are 25 µm in length.

