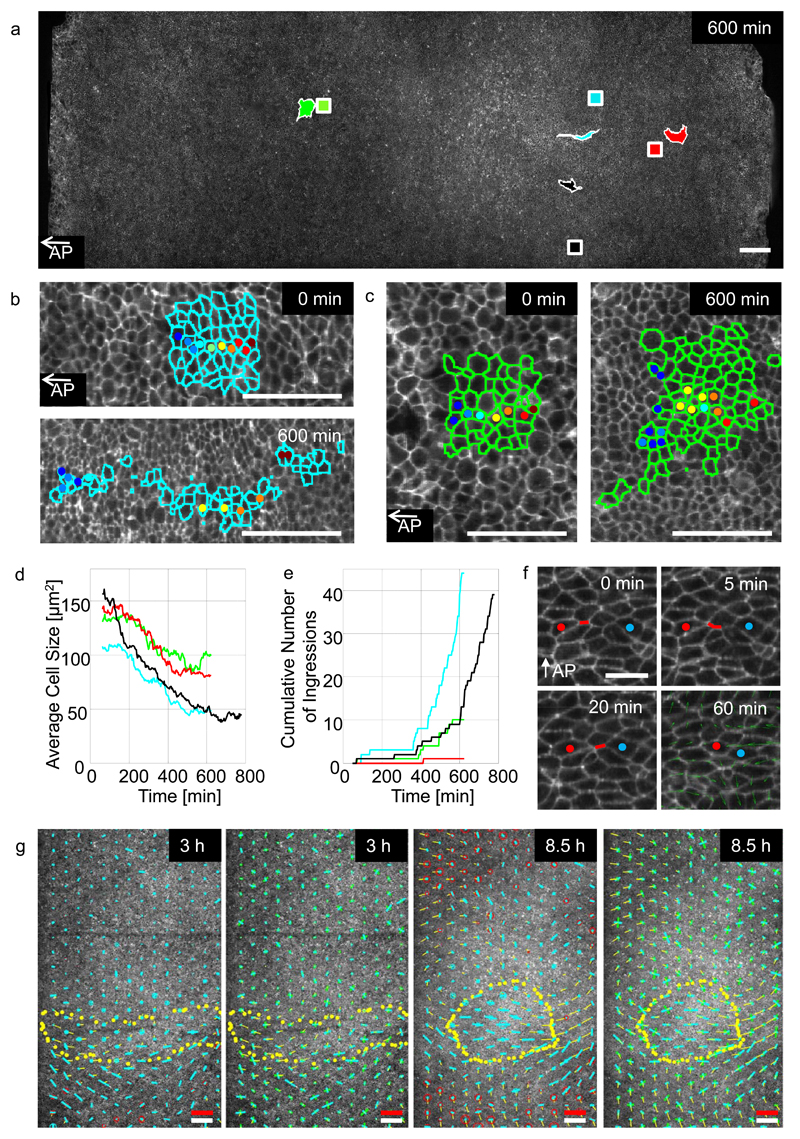
Figure 4. Analysis of cell behaviours controlling gastrulation.
a-) Analysis of cell behaviour in four distinct regions marked with different colour squares: the middle (blue) and lateral (black) sickle region, the area opaca (red) and a region in front of the sickle (green). The initial position of the domains are shown as squares, the same coloured irregular shaped domains indicate their positions and shape after 600 minutes. Scale bar 200 µm. b-) Shows outlines of cells manually tracked in the middle sickle domain (blue square) at the start 0 and after 600 minutes respectively. Scale bar 100 µm. c-) Cells tracked in the anterior domain (green) at 0 and 600 minutes respectively. Scale bar 100 µm. d-) Average cell size in the four domains (colours as in A). e-) Ingression of cells in the same four regions. f-) Example of sequential junctional contraction event in sickle region. The successive contractions generate a pulling force perpendicular to the streak axis and a pushing force along AP axis as shown by the velocity field (green arrows, averaged over 60 min). Scale bar 25 µm. g-) Quantitative analysis of the contraction expansion (red/blue circles) rate and shear rate (blue bar in the direction of contraction) of the total tissue strain rate at 3 and 8.5 hours of development (first and third panel). The strain rates are calculated from the changes in the lengths and direction of the vectors linking the centroid positions of all cells with their immediate neighbours as described in methods. The strain rate contribution of the rate of cell shape change (green bars) and the rate of cell rearrangement (blue bars) shown in the direction of contraction (second and fourth panel), are shown in the second and 4th panel. The dotted yellow line indicates the outline of the deforming endoderm. The thin yellow lines indicate the instantaneous velocities of the tissue at the time the strain rate tensors were calculated. The white scale bar in is 200 µm size marker, the red scale bar indicates a strain rate of 10-4/sec and a tissue velocity of 4 µm/min.

