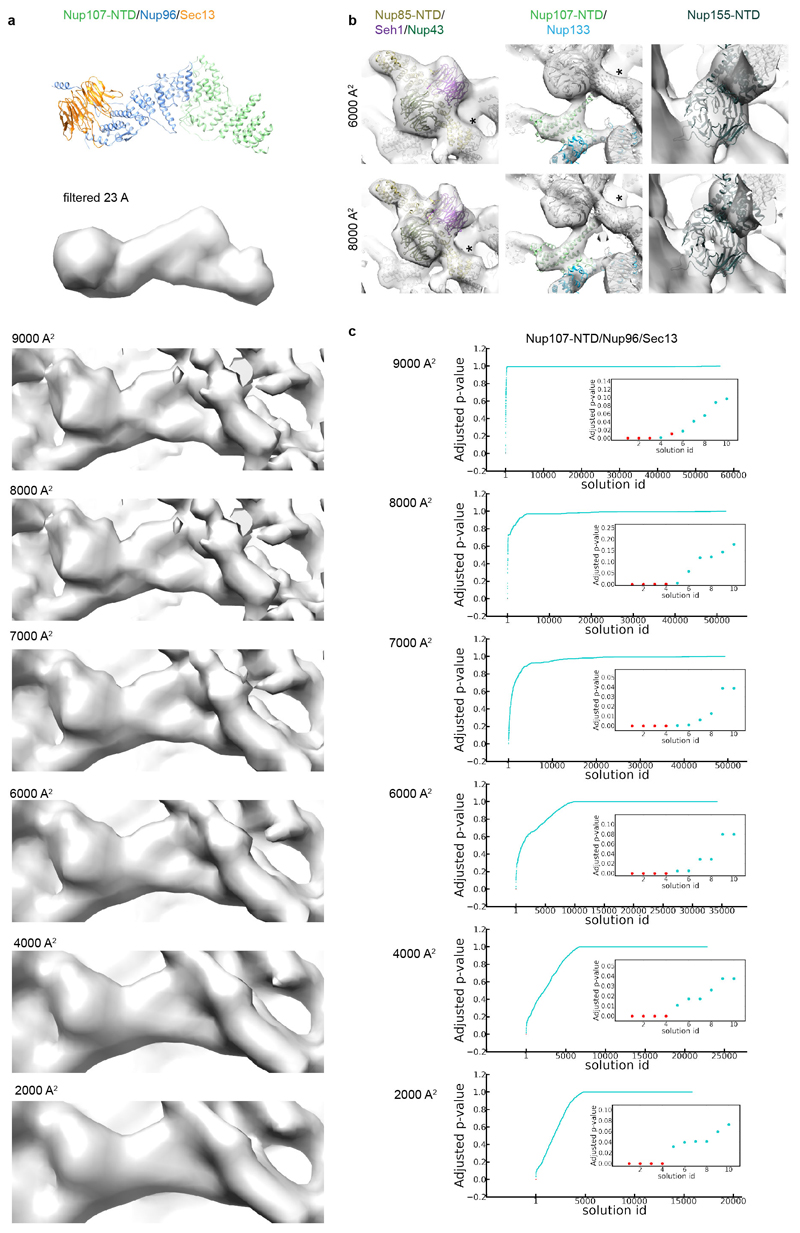
Extended Data Figure 2. B-factor correction.
X-ray structures filtered to the overall resolution of the tomographic map were compared to tomographic maps corrected with different B-factors to choose an appropriate B-factor. (a) X-ray structure of Nup107/Nup96/Sec13 at (top) and filtered to 23 Å (below) as compared to respective region of the outer vertex corrected with B-factors ranging from 2000 – 9000 A2. (b) B-factors of 6000 – 8000 A2 most realistically resemble features of the X-ray structures. Three regions of the tomographic map are superimposed with the respective X-ray structures at B-factors of 6000 A2 in comparison to 8000 A2. In these well-resolved regions, additional features such as more detailed shapes of beta propellers or the Nup107 finger domain (see also Fig. 2a, b; Extended Data Fig. 4e) are apparent at 8000 A2. Due to local deviations in resolution (Extended Data Fig. 1c, d) a more conservative B-factor of 6000 A2 was chosen to correct the averages. Asterisks mark structures that can be unambiguously positioned but have some uncertainty in their orientation, that is the Nup85-CTD. (c) Systematic fitting of the X-ray structure of Nup107/Nup96/Sec13 into the tomographic map as shown in Extended Data Fig. 7a but at different B-factors. Adjusted p-values are shown ranked; the four true positive hits are shown in red in the inset. The latter are consistently identified as top hits, except when a B-factor of 9000 A2 is used.

