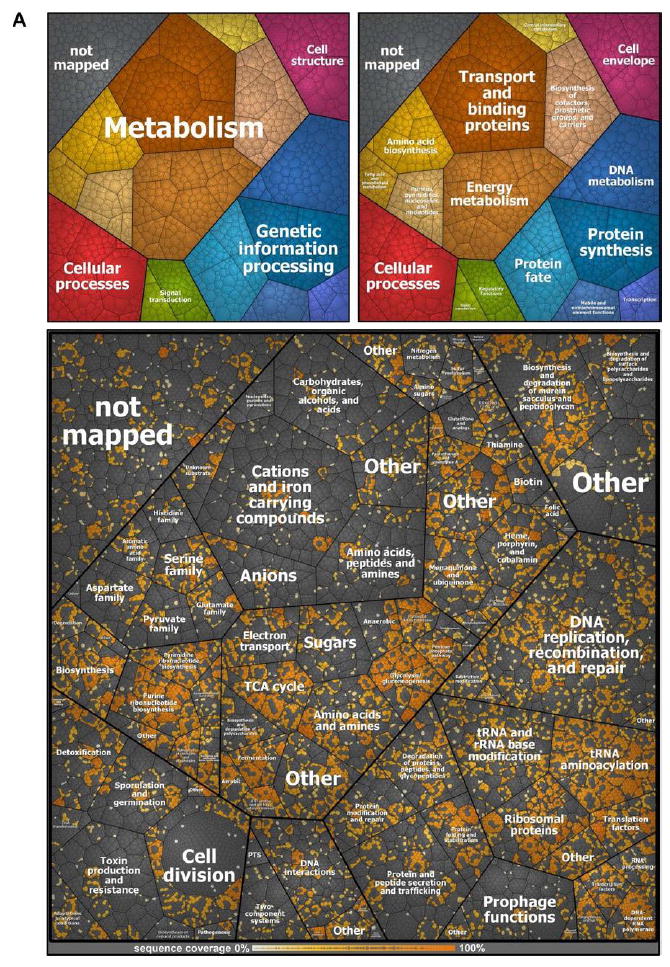
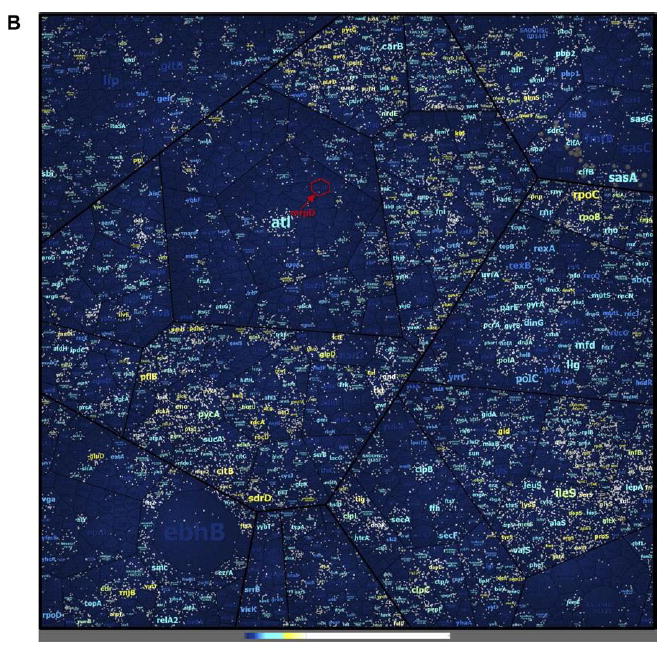
Figure 3.


Peptide and protein coverage. The coverage of the annotated proteome of S. aureus HG001 using the three methods of proteome analysis under investigation (A).The Voronoi treemap was created on the basis the TIGRFAMs protein family classification scheme [33] by using HMMER/HMMScan [34]. The small graphs in the upper part display the included functional annotations. Peptides form the lowest level of area subdivision. The area per peptide represents the peptide length (number of amino acids). Therefore, the area per protein correlates with the protein size. Detected peptides of proteins identified by at least one of the three methods applied in this study (three biological replicates, without technical replicates) are colored in shades of orange. The color represents the sequence coverage of the proteins by the detected peptides. Peptides not detected in any set of three biological replicates per method are colored gray. Nevertheless, some of these proteins were identified when technical replicates were included to generate an even more comprehensive new database (SpectraST). Coverage of peptides from an in silico digestion in the real MS data sets (B). Included functional annotations are the same as depicted in Fig. 3A. Additionally, the protein label size correlates with the protein size. White dots indicate the detected peptides from the MS data sets. Coloring was applied to the protein labels: Dark blue labels indicate proteins not identified. Light blue, yellow, and white coloring indicates in this order increasing coverage of identified proteins. The Voronoi treemap contains about 220245 theoretically expected peptides from an in silico digestion. Of these, about 19109 peptides were detected in the MS data sets.
